Blog
Visualizing the signal in the noise
Explaining our world through code and charts. Featuring research on the AI revolution, world affairs, web design and development, and the occasional book review. This blog is my personal data-driven exploration of politics, technology, code, and culture.
Learn about data visualization here, explore an overview of my work below, or even better, send an email to get in touch.
Posts

Resources
AI Trends
Essential reading about GenAI
Presentation
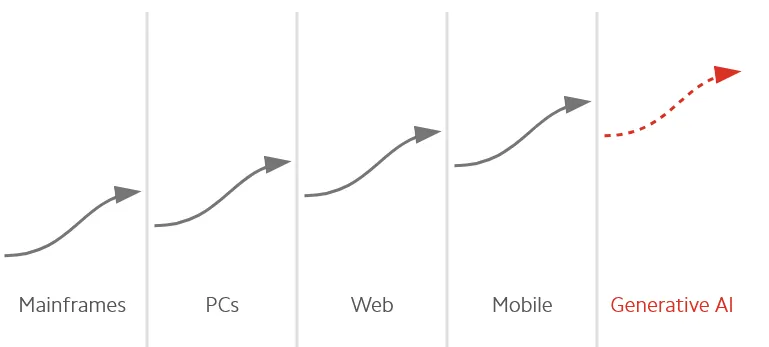
AI Eats The World
Analysis of Benedict Evans' Thesis
Safety
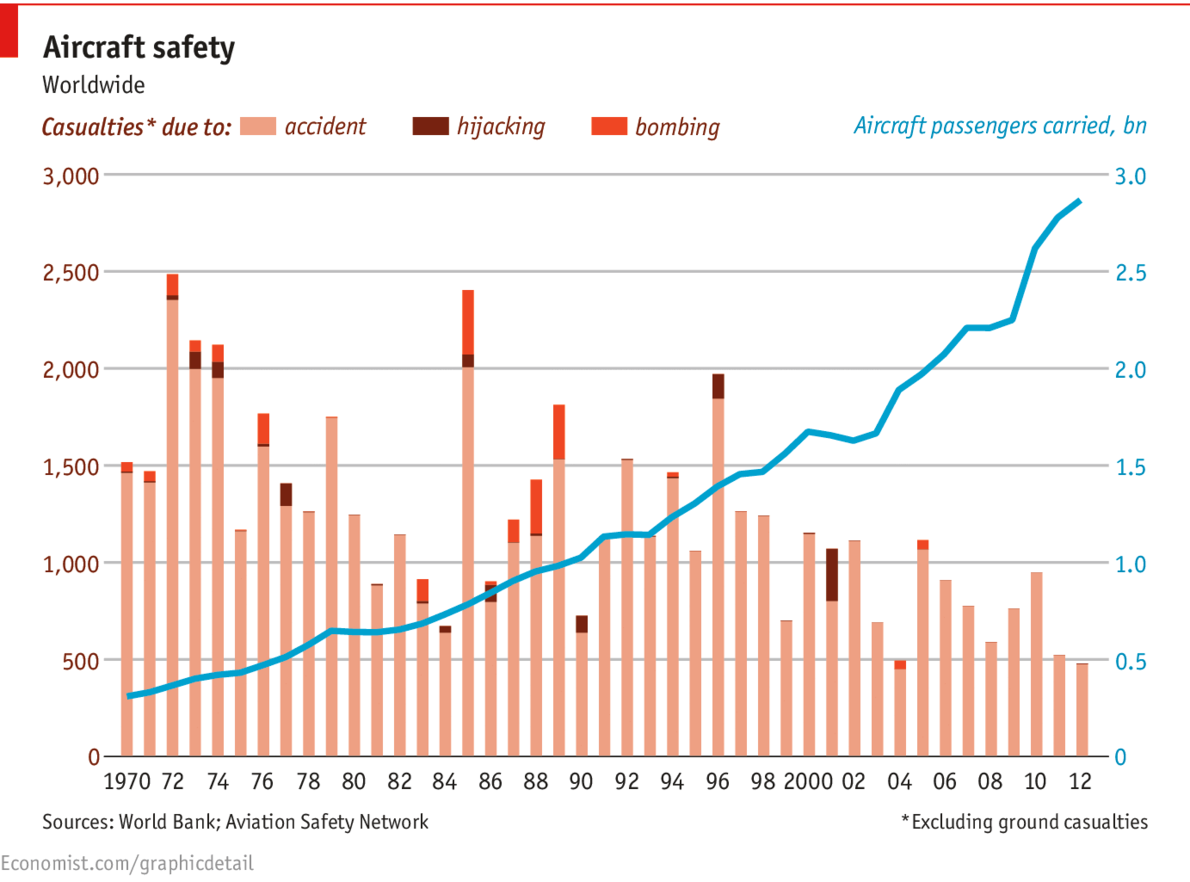
Plane Crash Deaths
Air travel is getting safer
Jobs
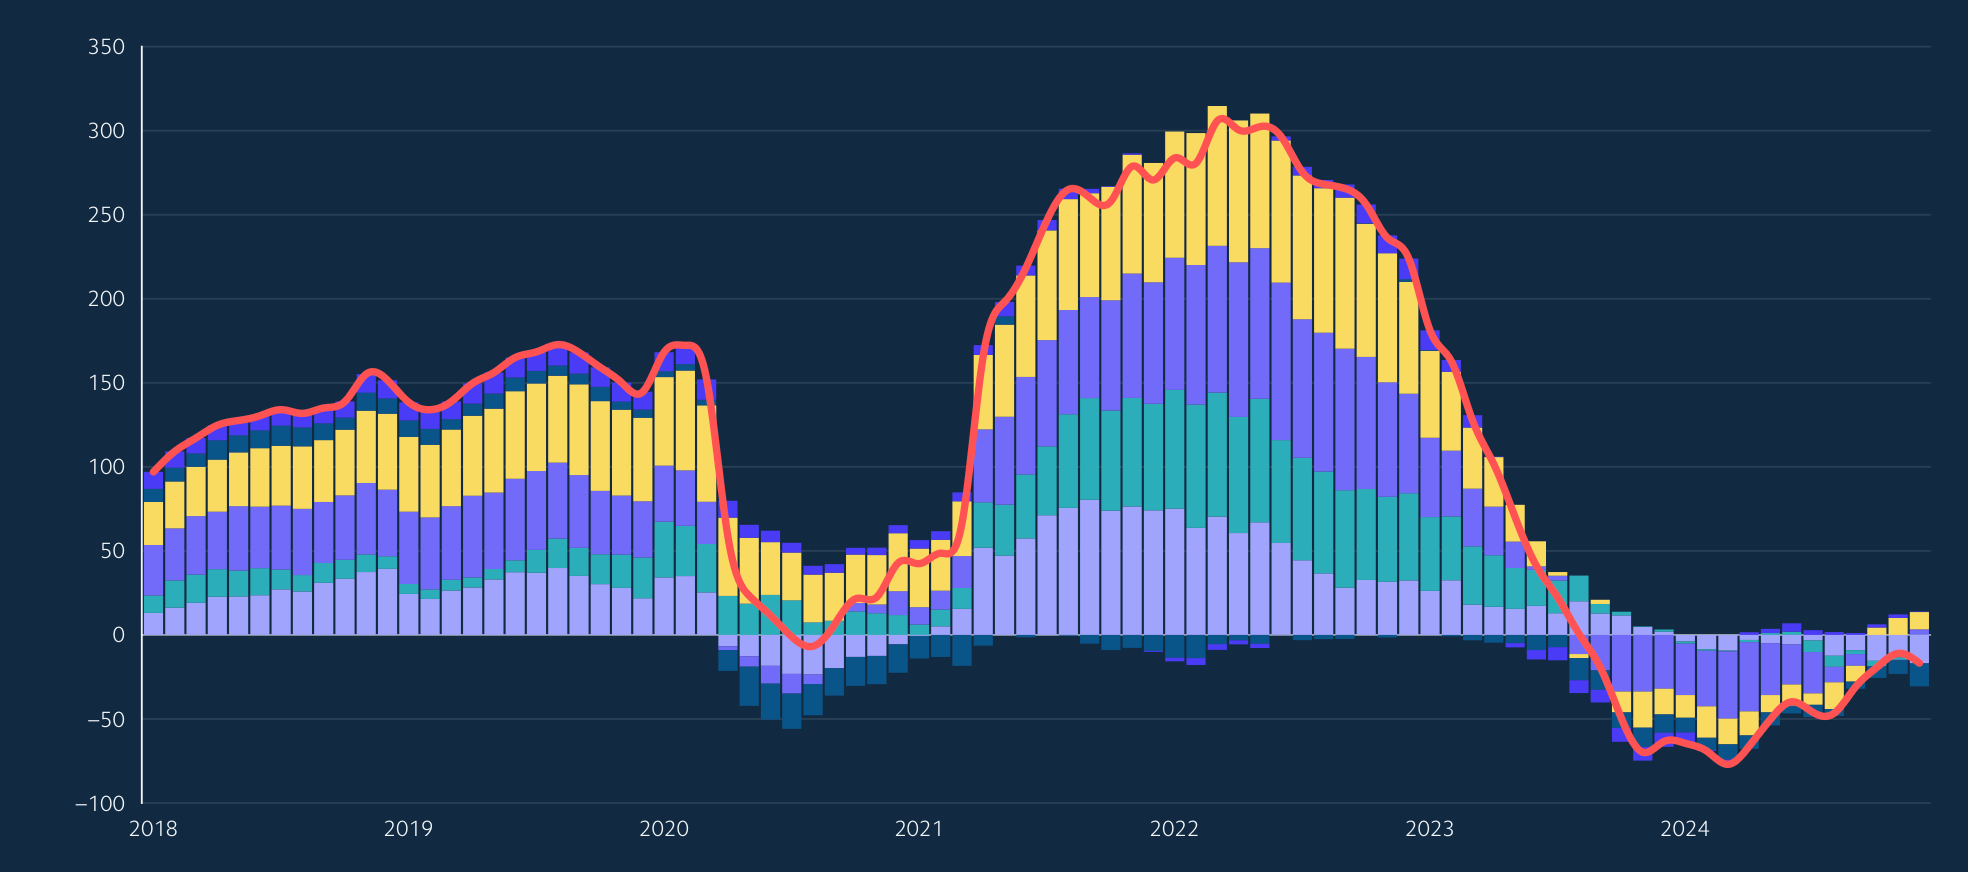
Tech Turns the Corner
Year-over-Year change in US tech employment

Health
Is Alcohol Worse Than Heroin?
The relative harm of drugs

Sports
New goal standard
Alex Ovechkin's path to top scorer in the NHL

Politics
Picking a president
The Electoral College vs. Popular Vote

Bombs in Beirut
Operation Grim Beeper
How Israel turned batteries into bombs
USA
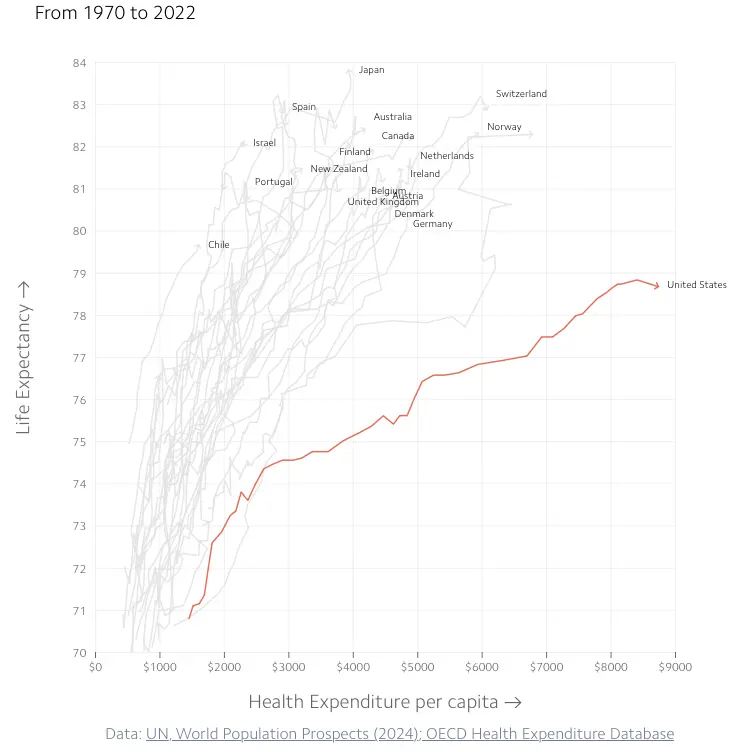
American Sickness
Salve lucrum

Buzzkill
Drones in Ukraine
A thousand snipers in the sky

Data viz
Choked Up
The link between child poverty and air pollution
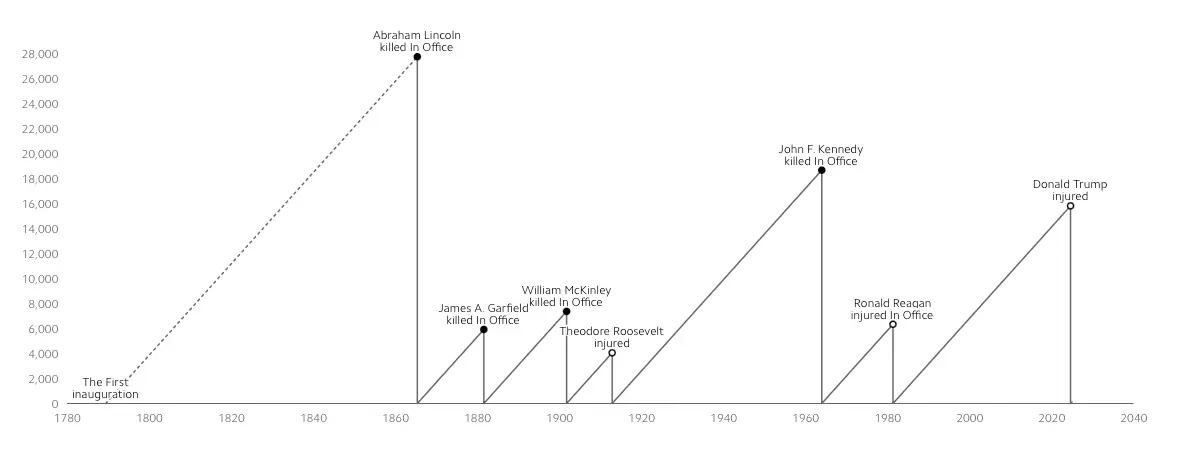
USA
Assassinations
Days since a US President was last shot

Technology
The Planets

Technology
Global Flight Map
World flight paths
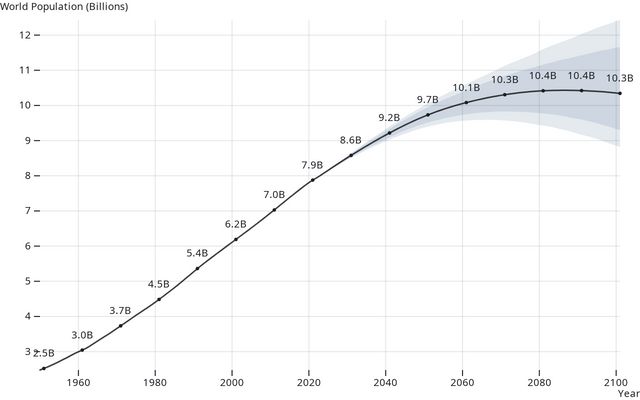
World
UN Population Projections

USA
Domestic Extremism in America
The enemy within
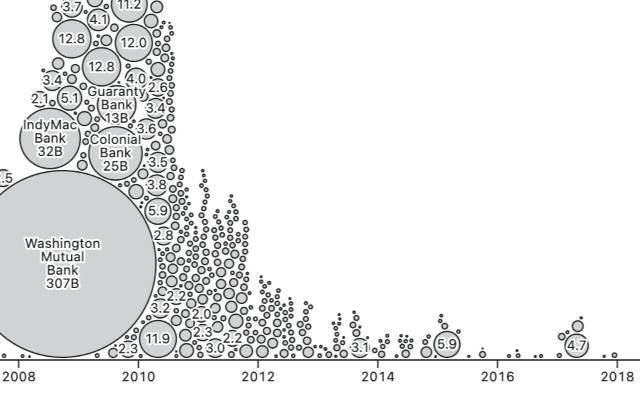
USA
The Big Short
US bank failures
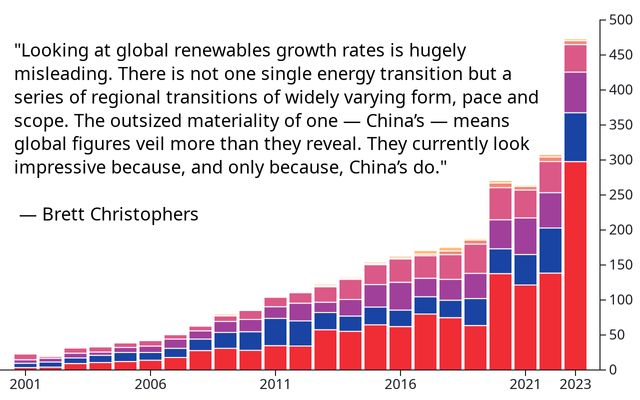
Power Up
Charging Forward
China leads the way in renewables
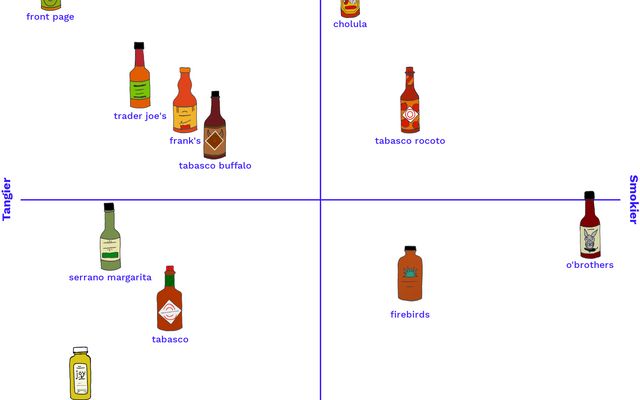
Data viz
The spice is nice
Hot sauce power rankings

Technology
Space Waste
Mapping lunar debris
Out there
SpaceX
Reusable rockets are becoming reality
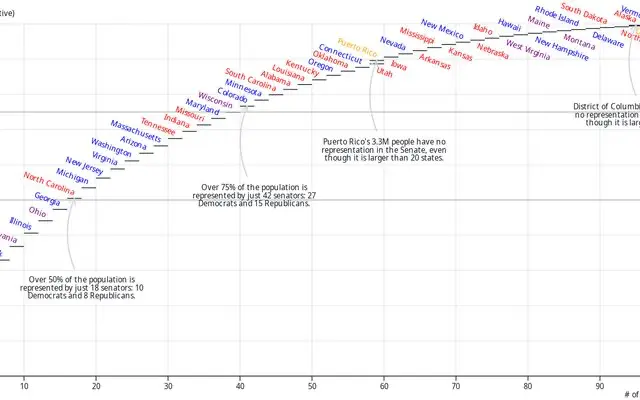
USA
How 'democratic' is Congress?

USA
Time in office
US Presidents by birth year and age.
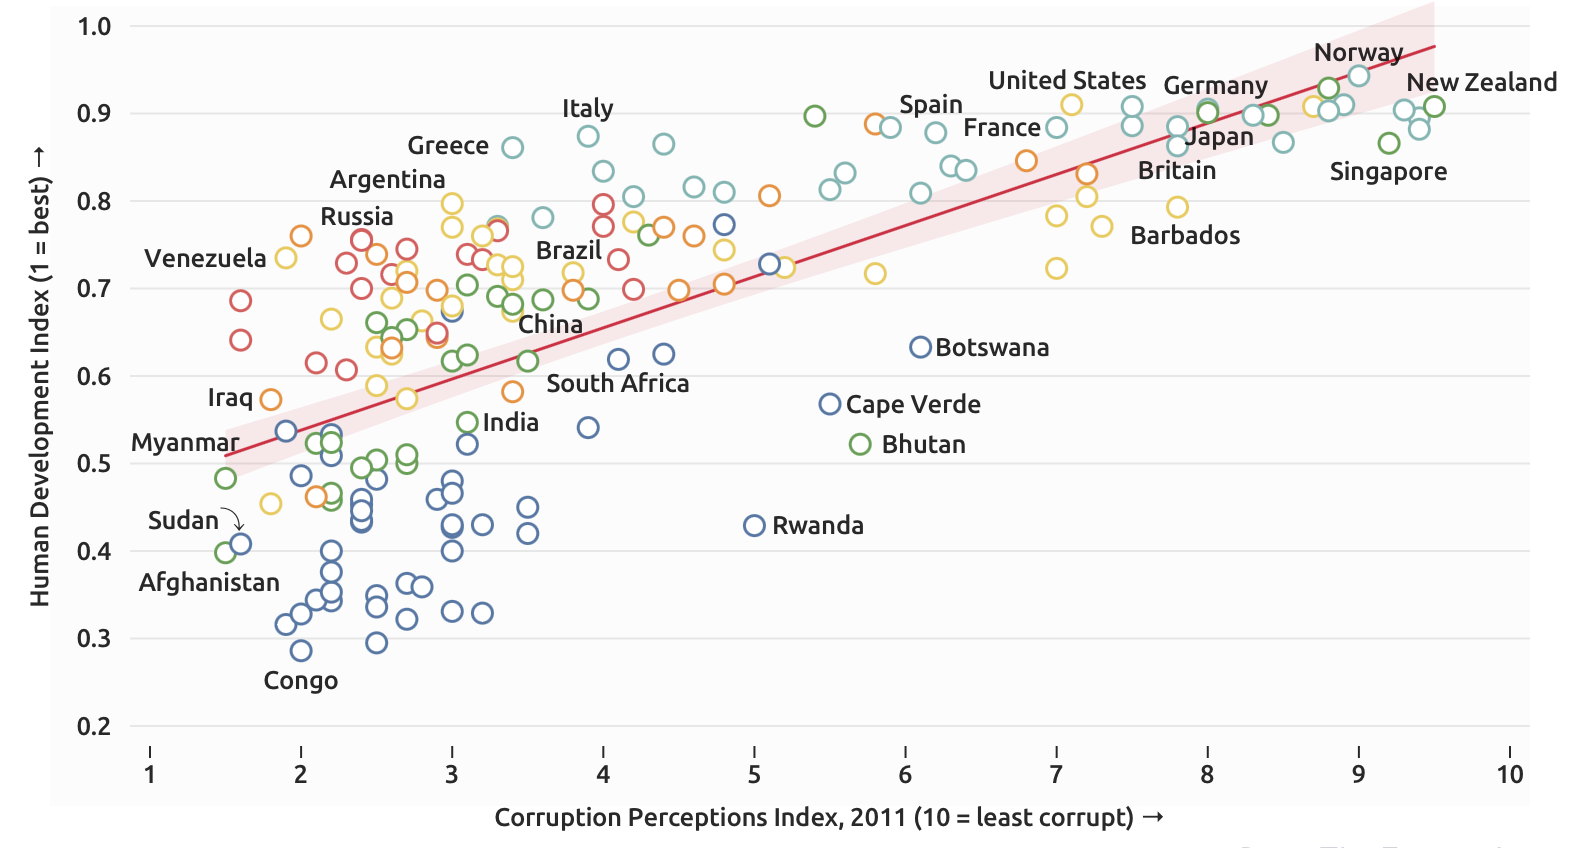
World
Corrosive Corruption
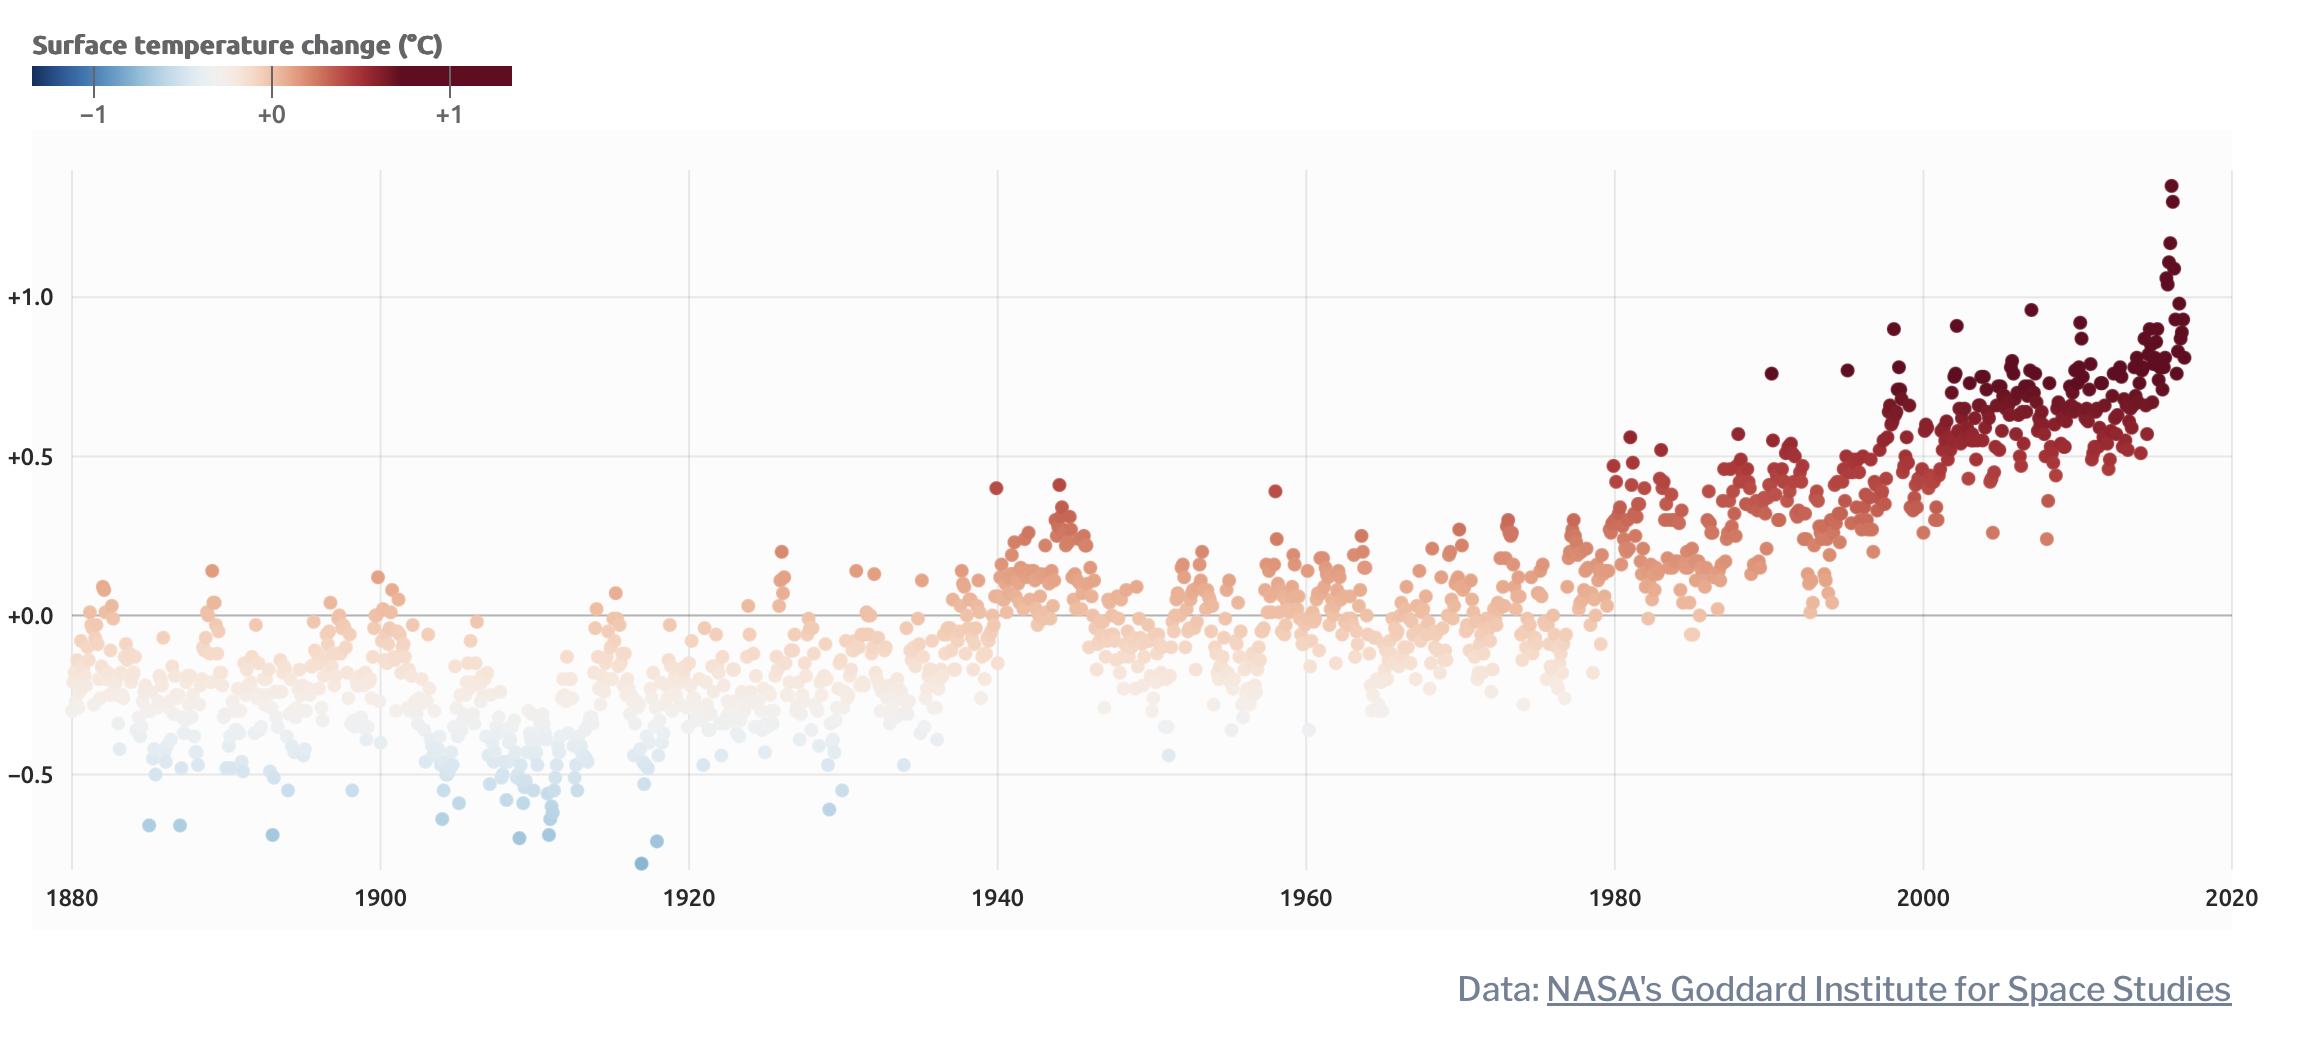
World
Global Temperature Trends
It's getting hot in here.

USA
Keys to the White House
Historically based prediction system
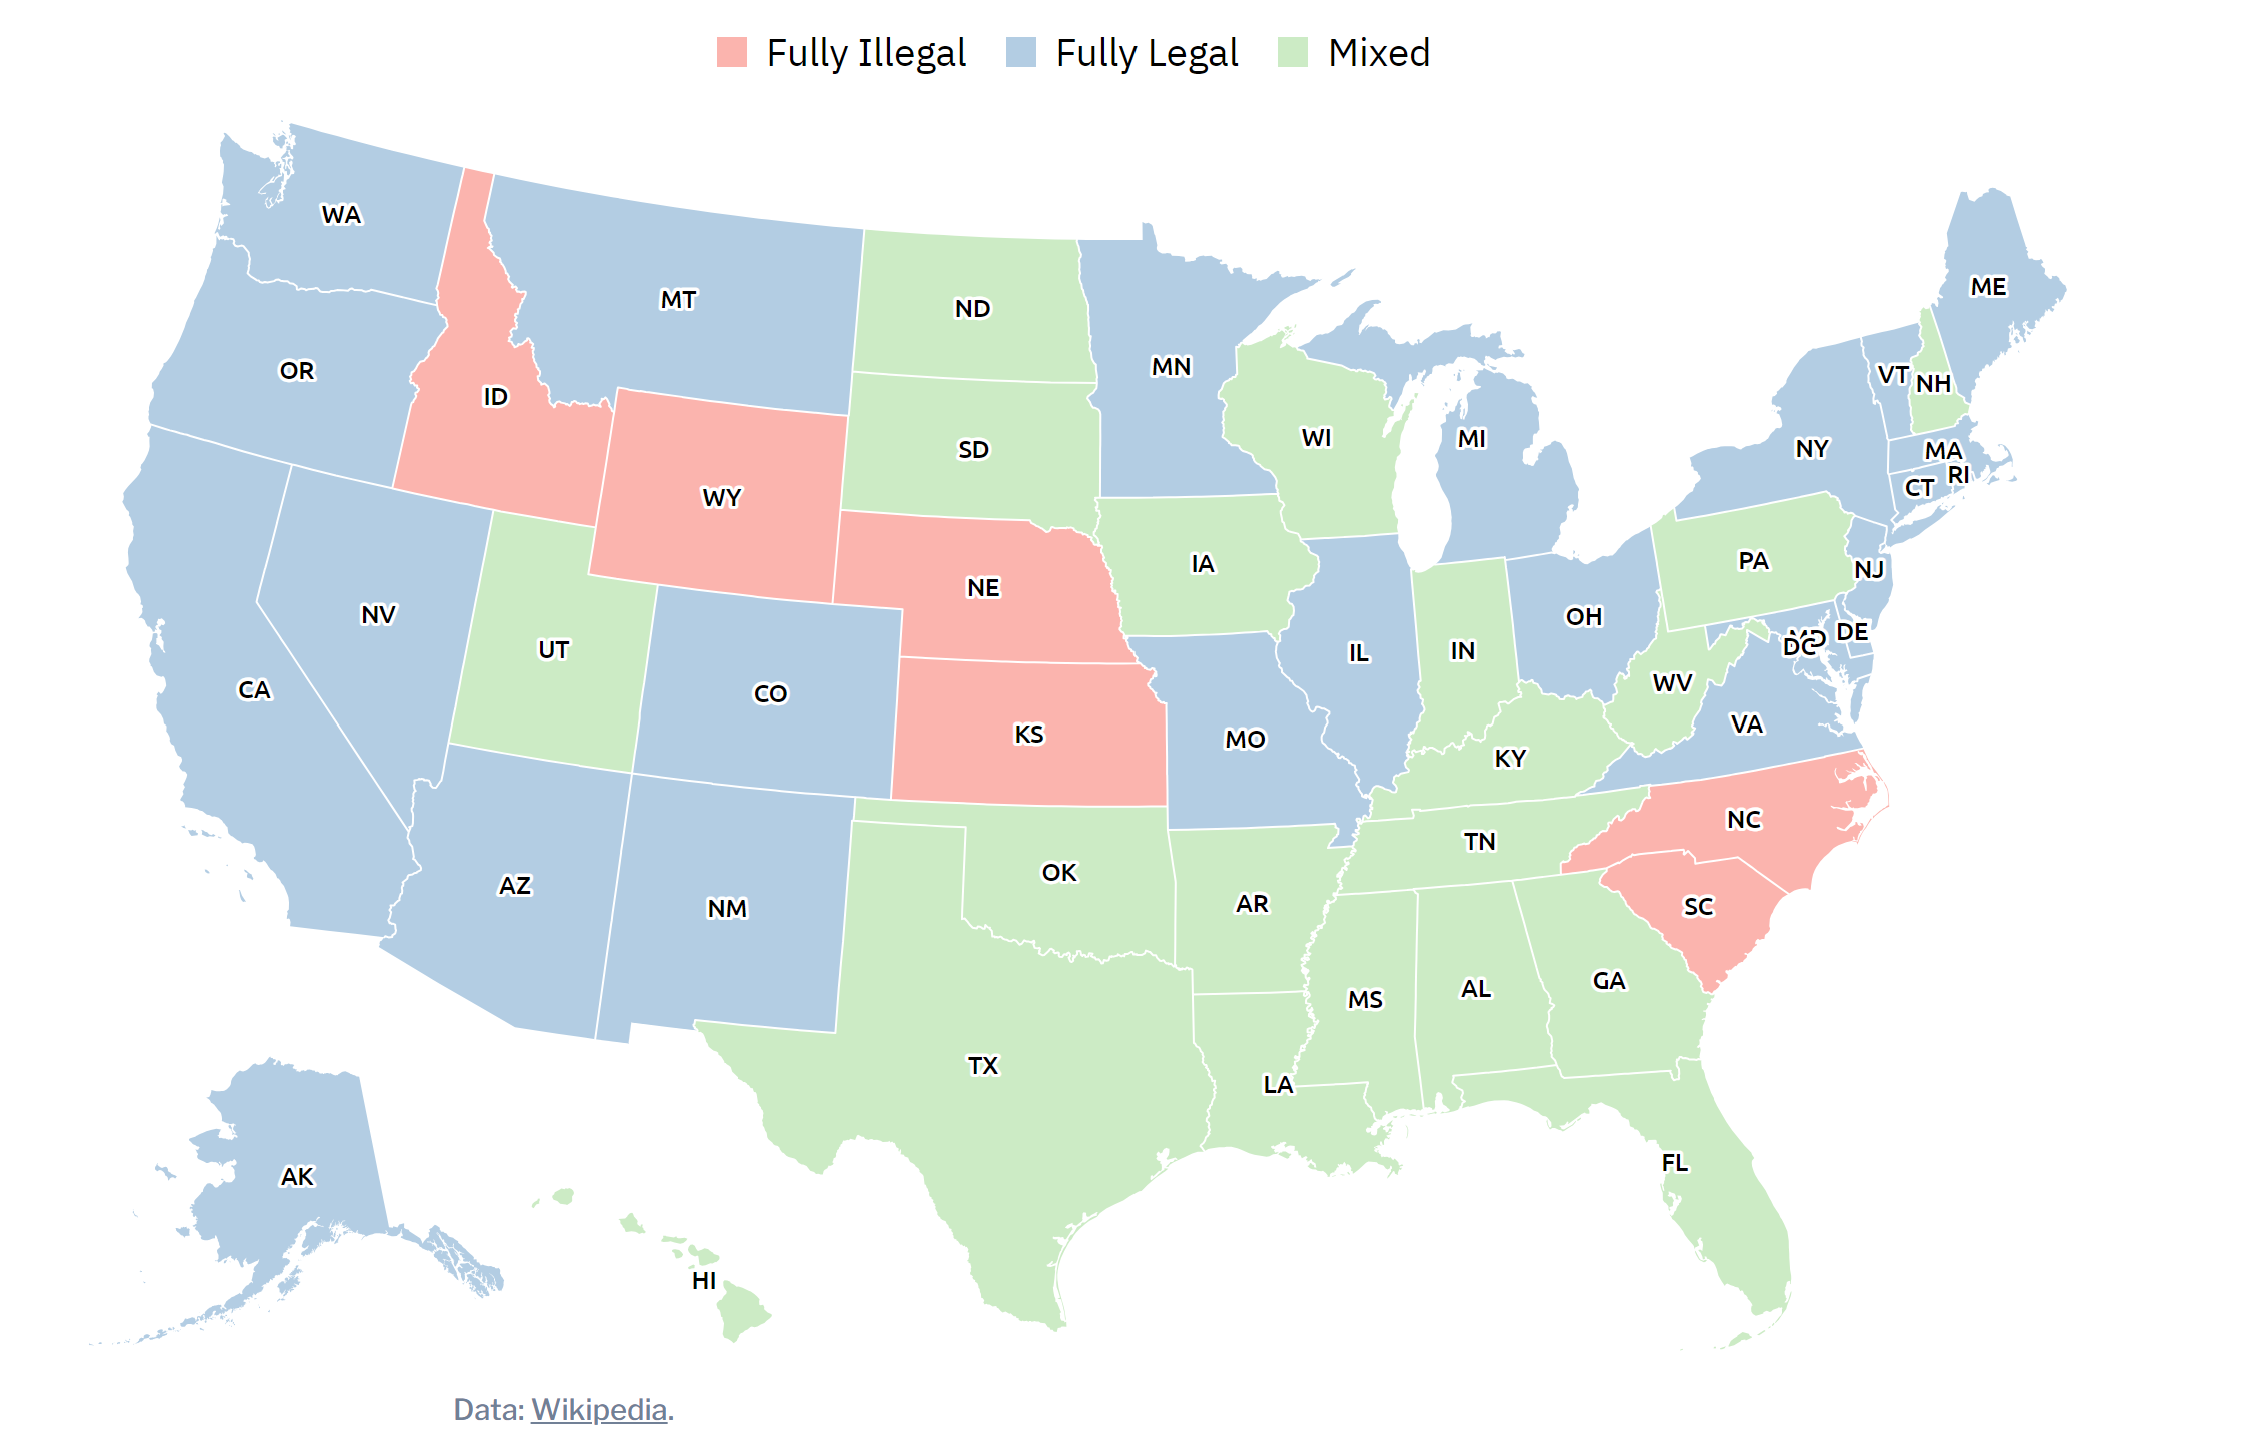
USA
Altered States
Marijuana laws in the United States

USA
Thoughts & Prayers
Mass shootings in America
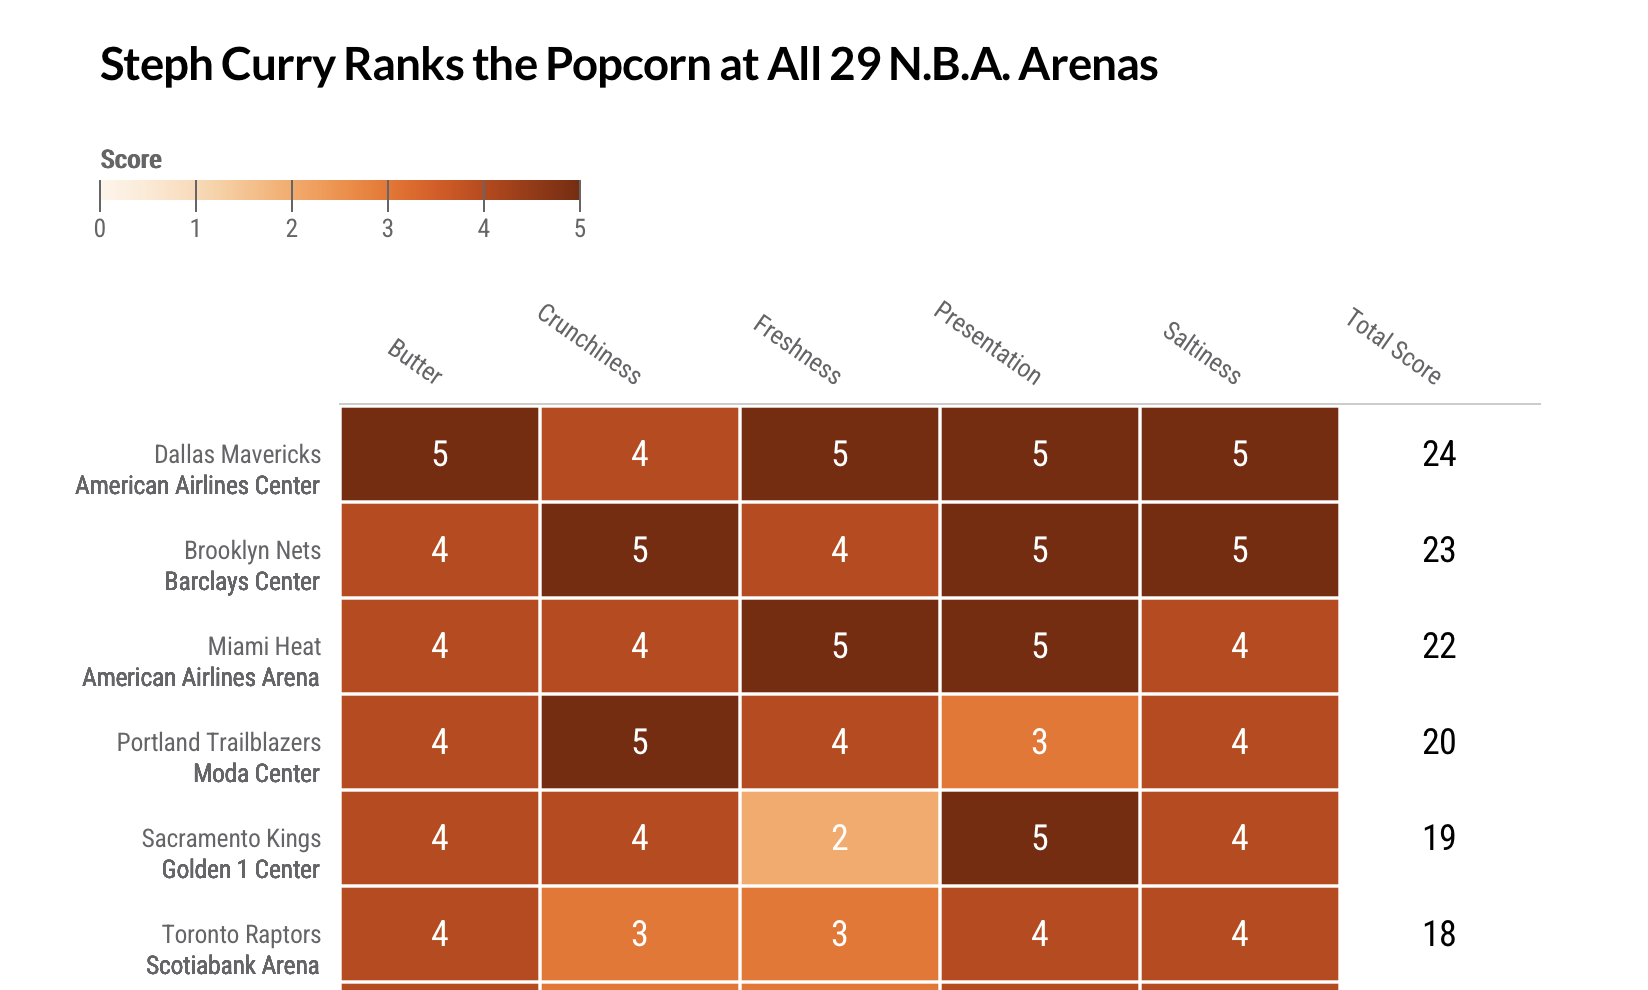
Sports
Steph Curry's Popcorn Problem

USA
State of the Unions
Union membership is on the decline
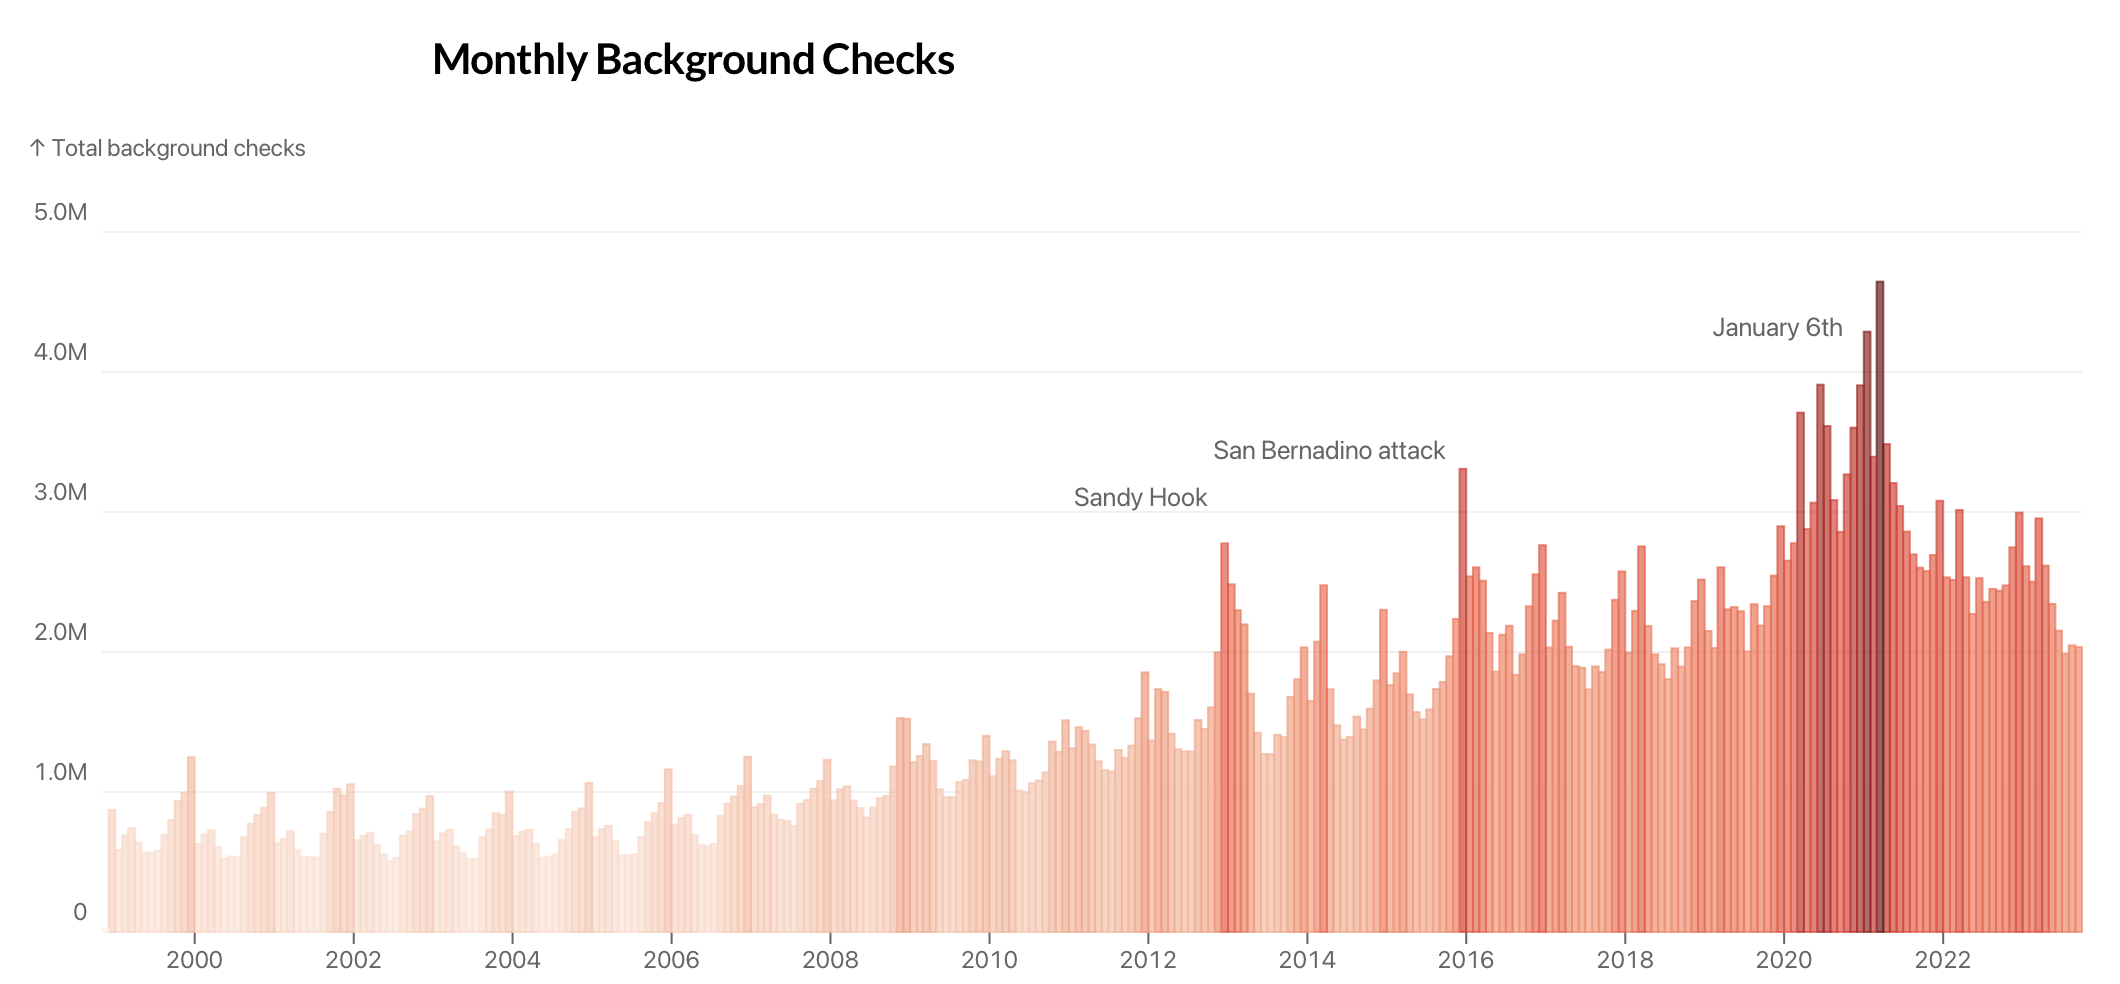
Guns
Checkmate
NICS background checks

Design
Pantone® color of the year

Data viz
The Carrie Bradshaw Index
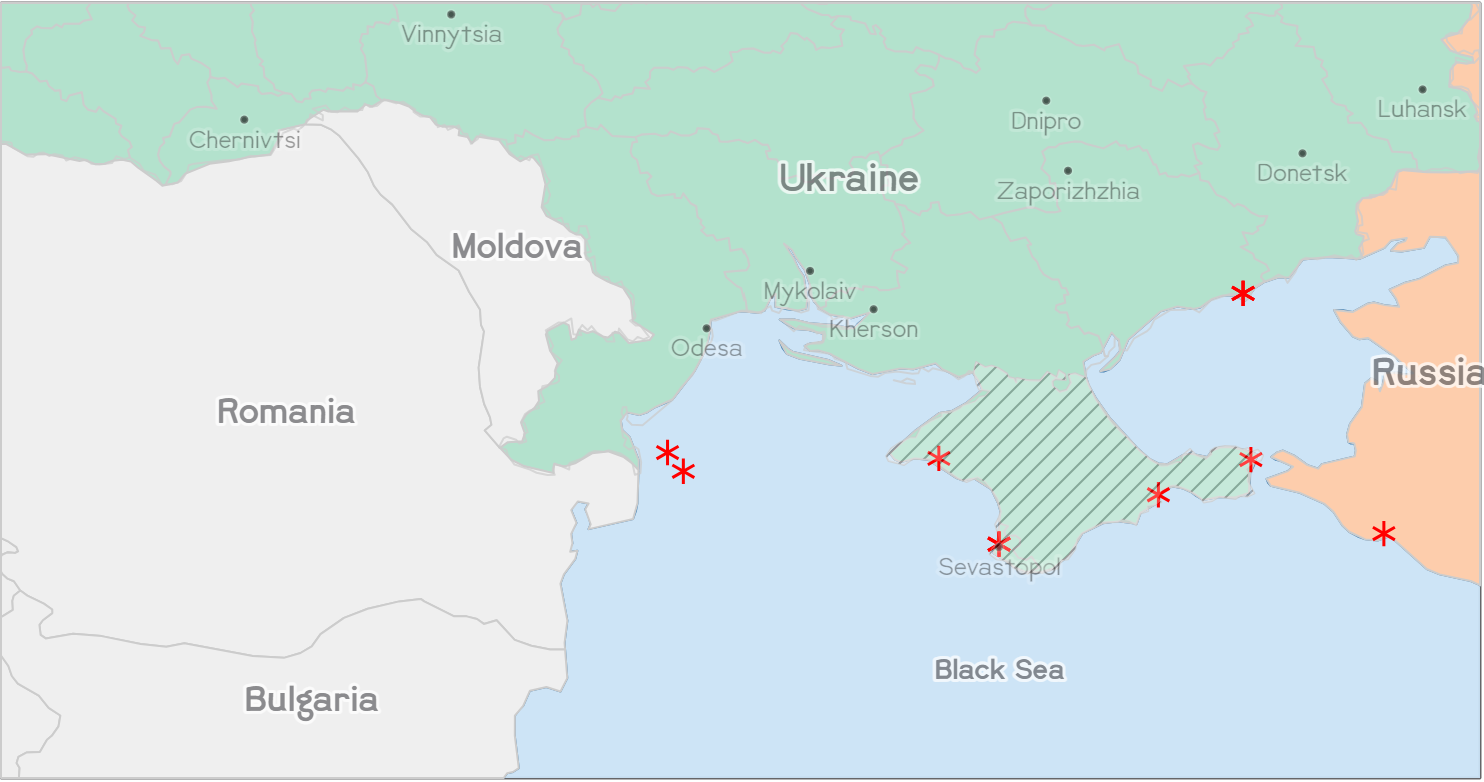
Ukraine War
Black Sea Fleet Losses
"Russian Warship, go fuck yourself"

Data viz
Palmer's Penguins
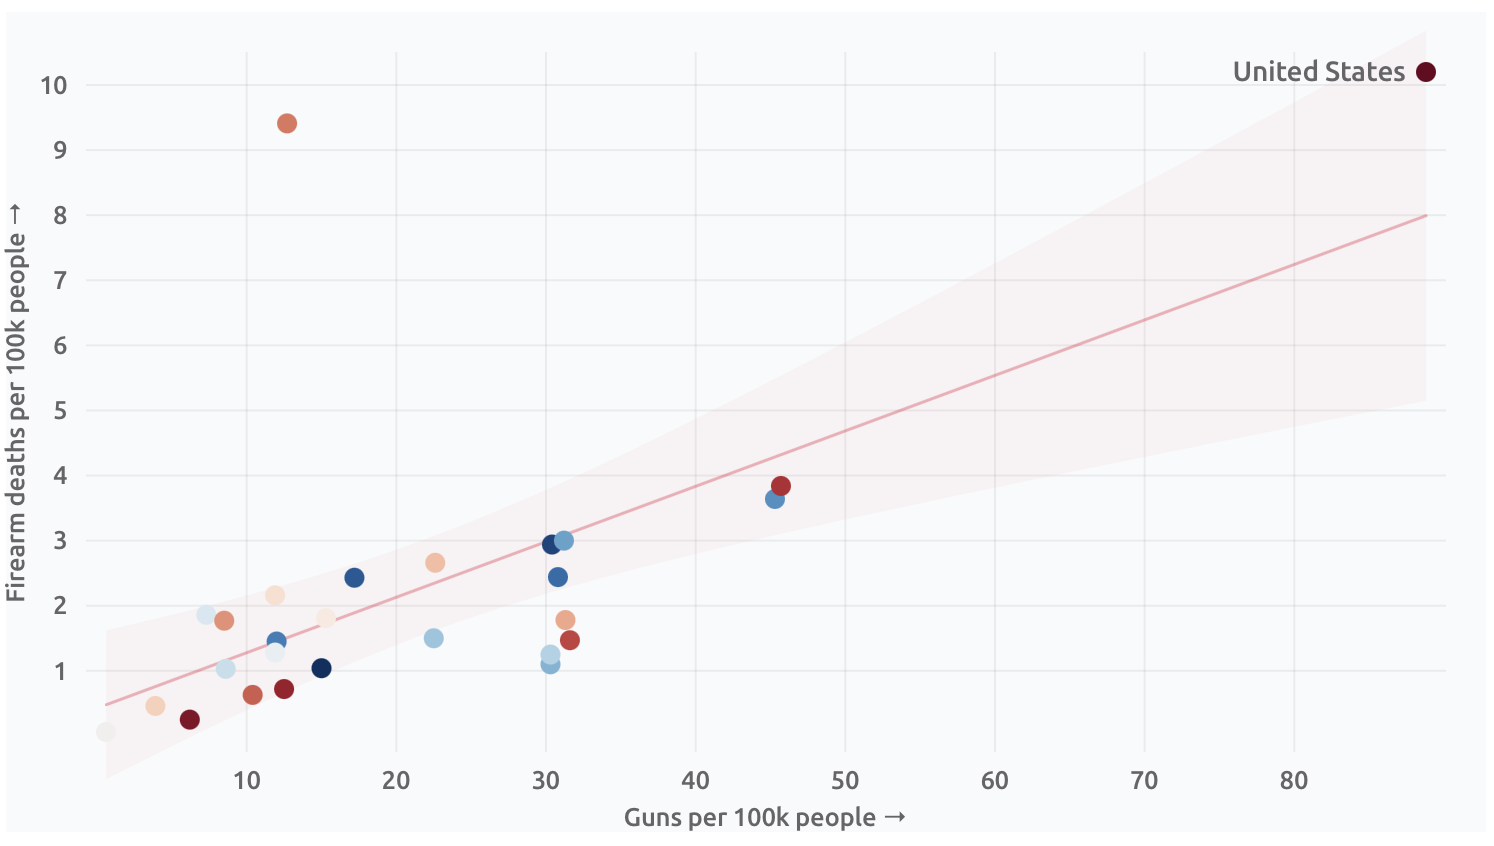
Guns
Lethal Passage
Sensible gun control recommendations
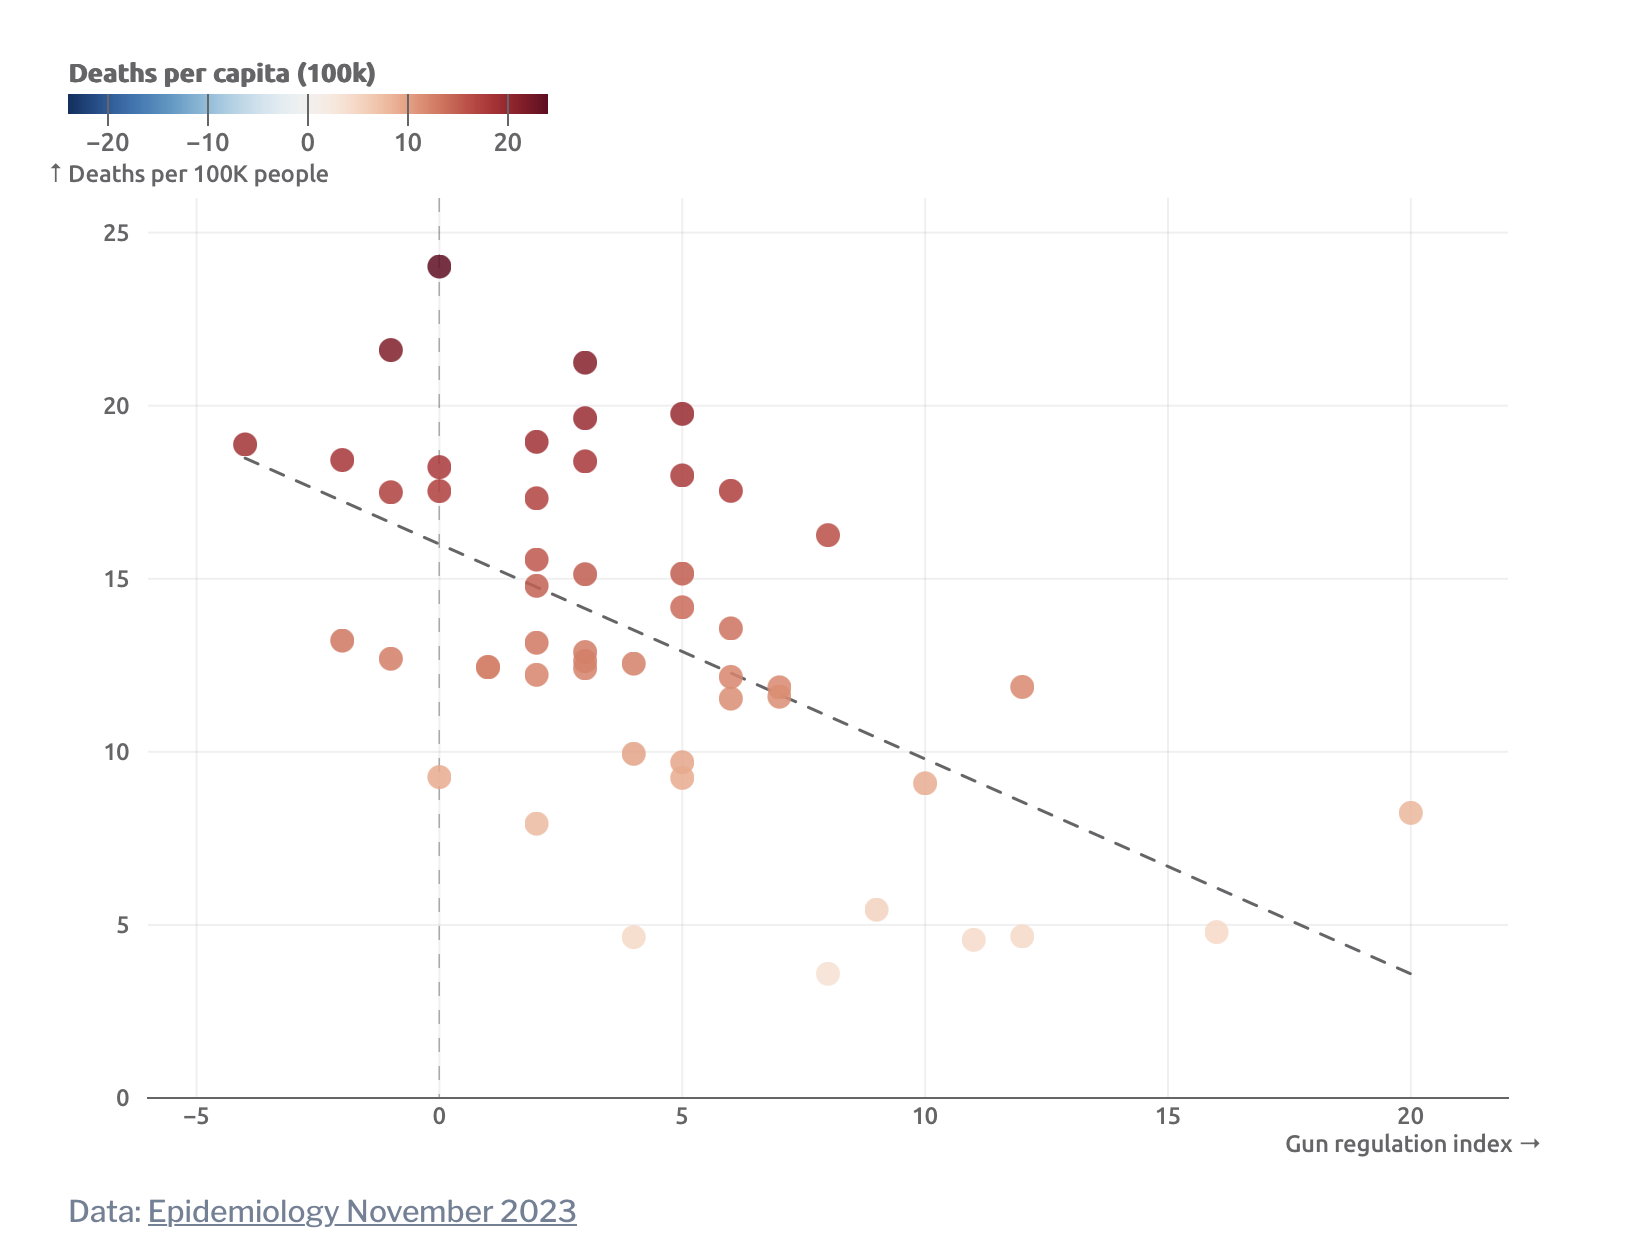
Guns
Gun Regulation Index
Restrictive gun laws save lives
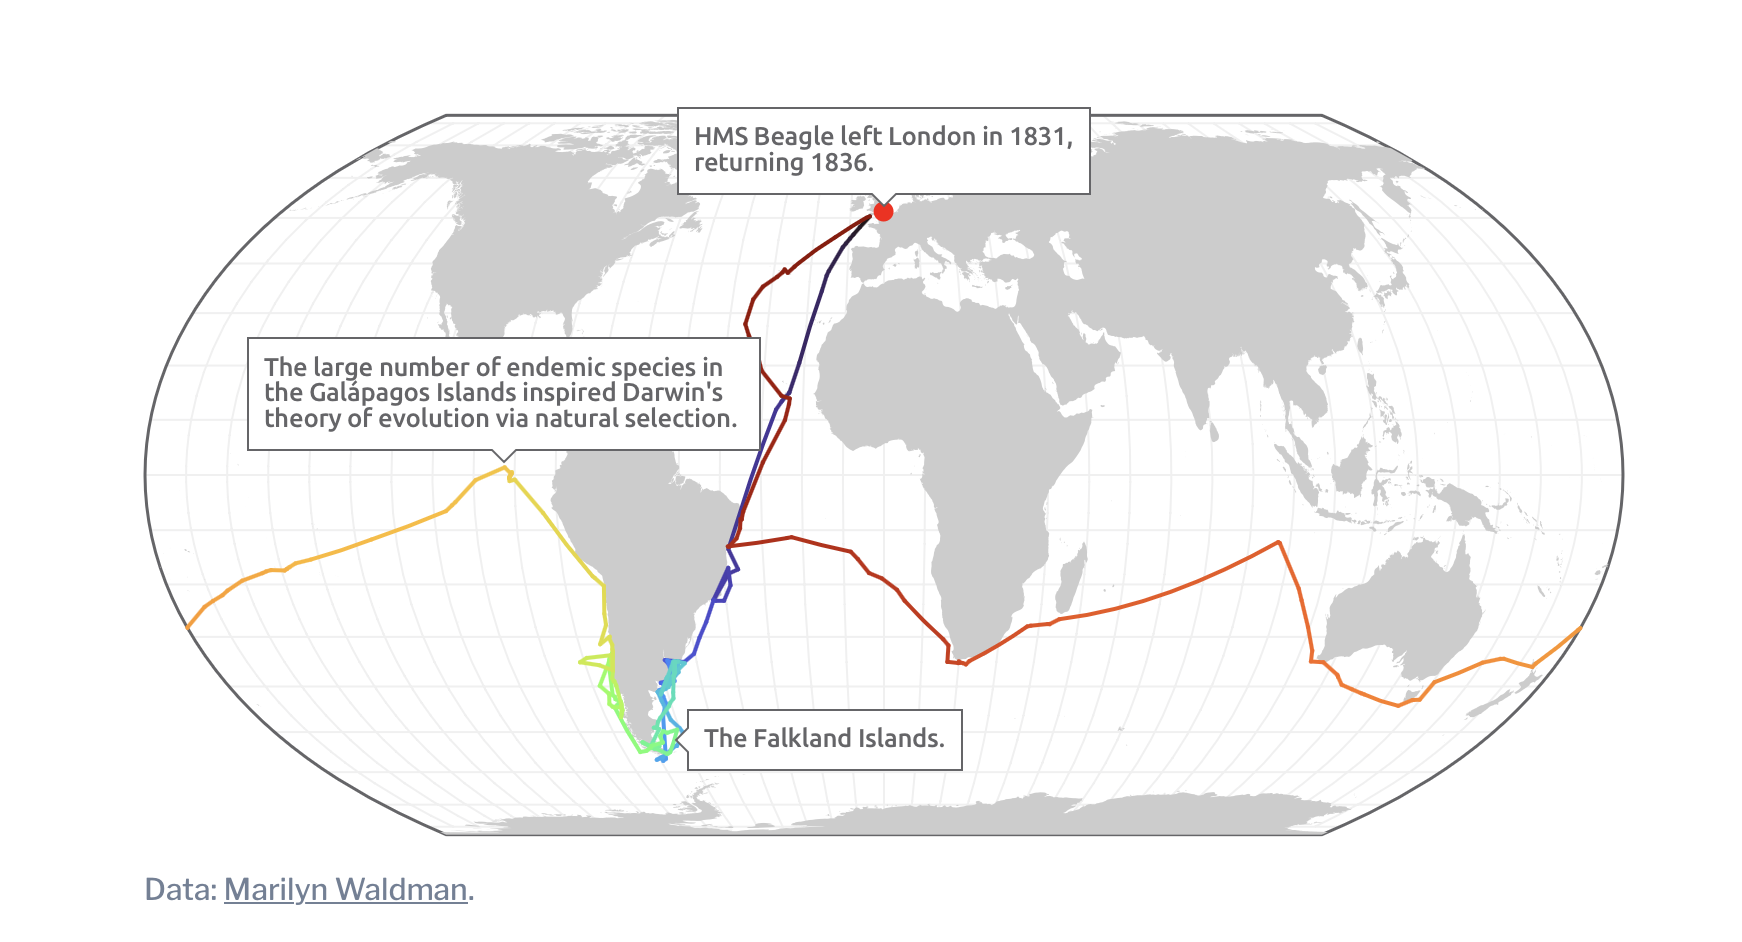
Data viz
The voyage of Charles Darwin
Aboard the HMS Beagle
Data viz
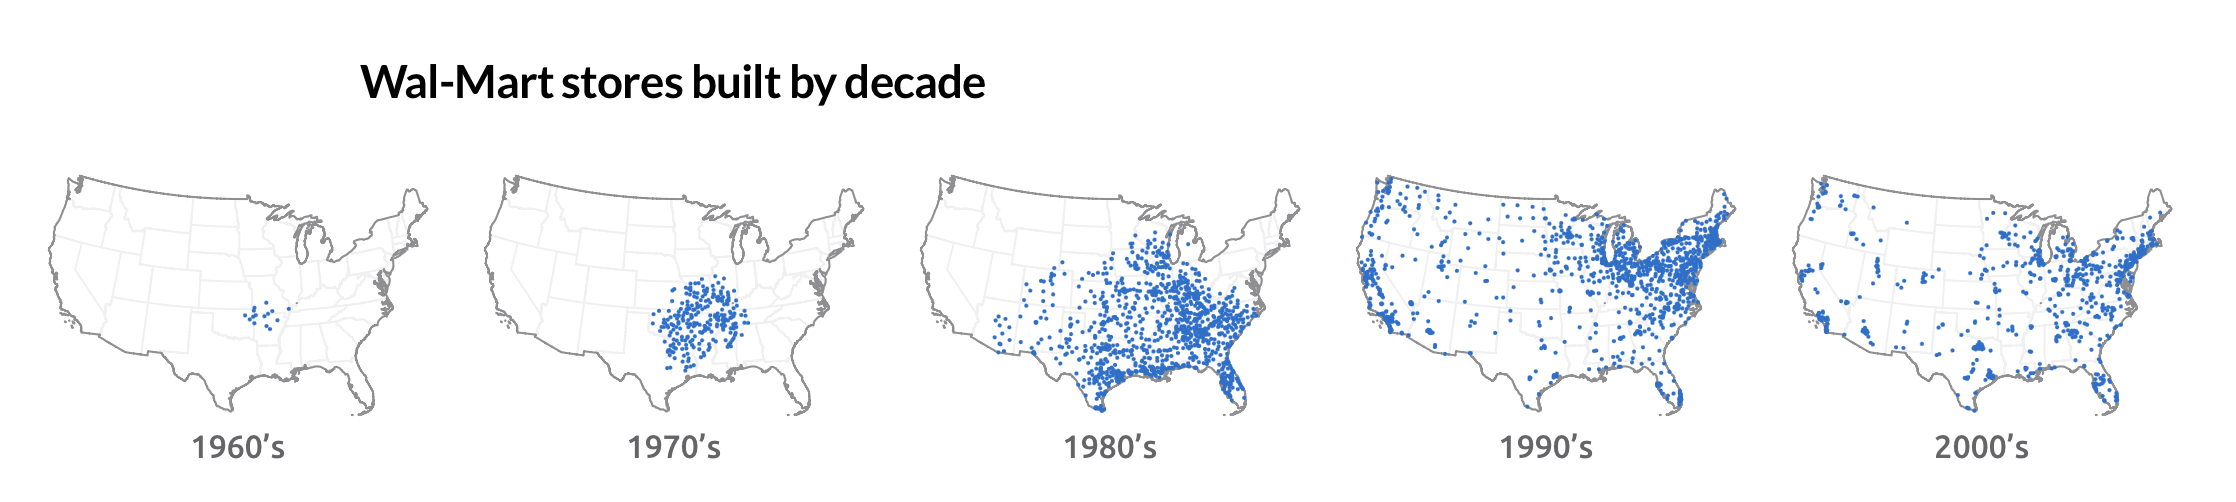
Sprawl-Mart
The growth of Wal-Mart stores

BLM
8 minutes, 46 seconds
Data viz
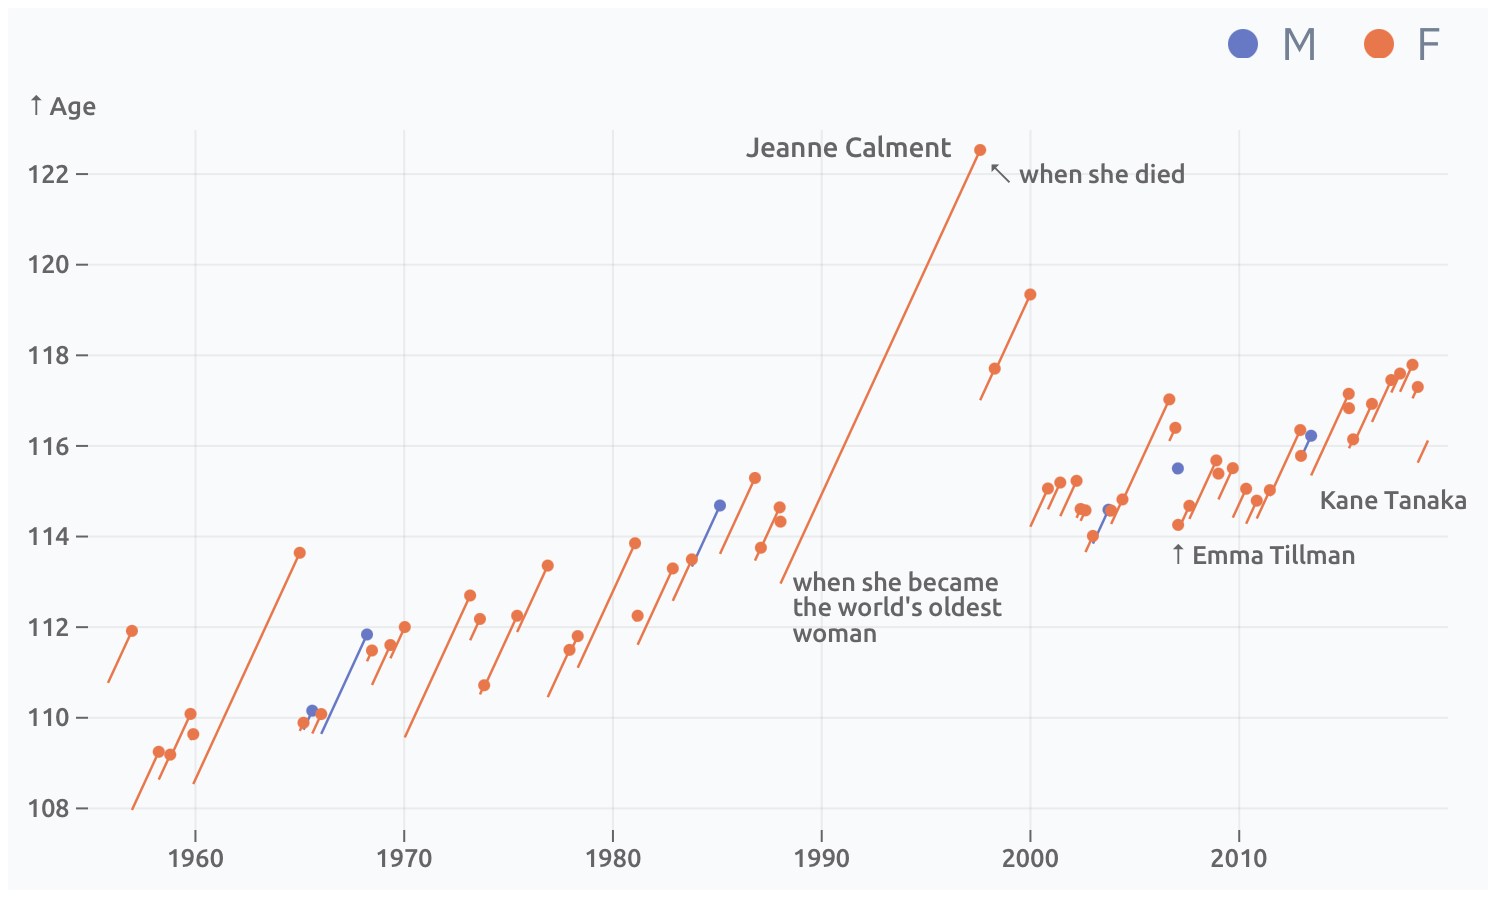
World's Oldest Person Titleholders
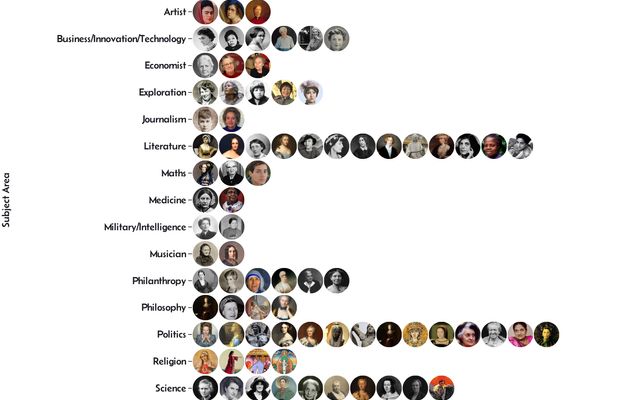
Femme Fatale
Famous Women
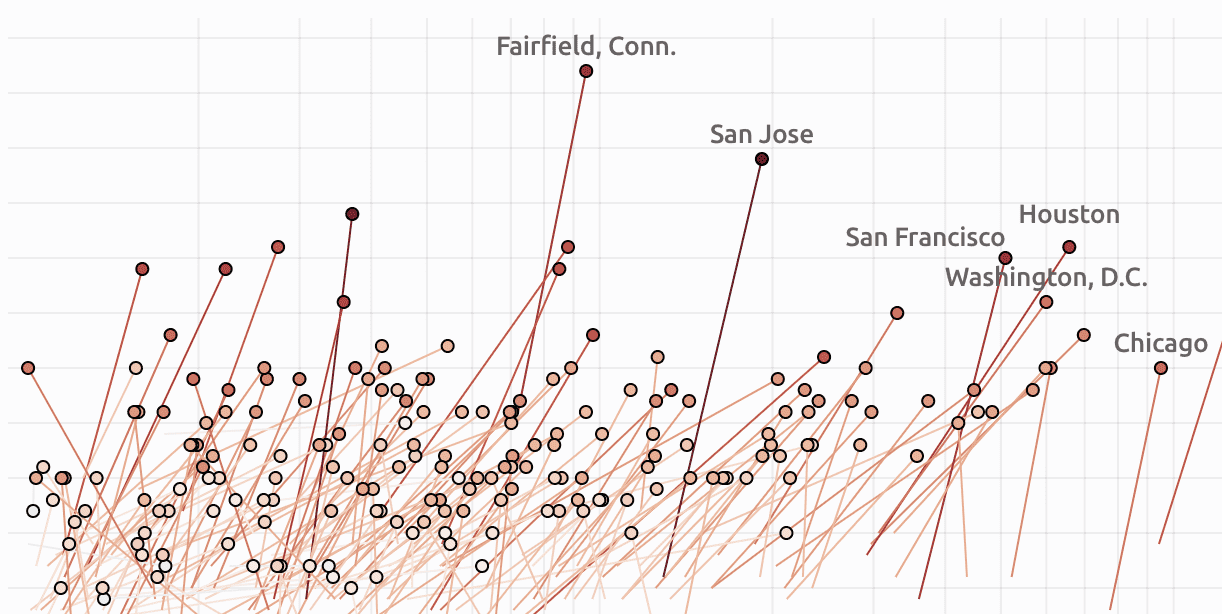
USA
Inequality in America
From 1980 to 2015
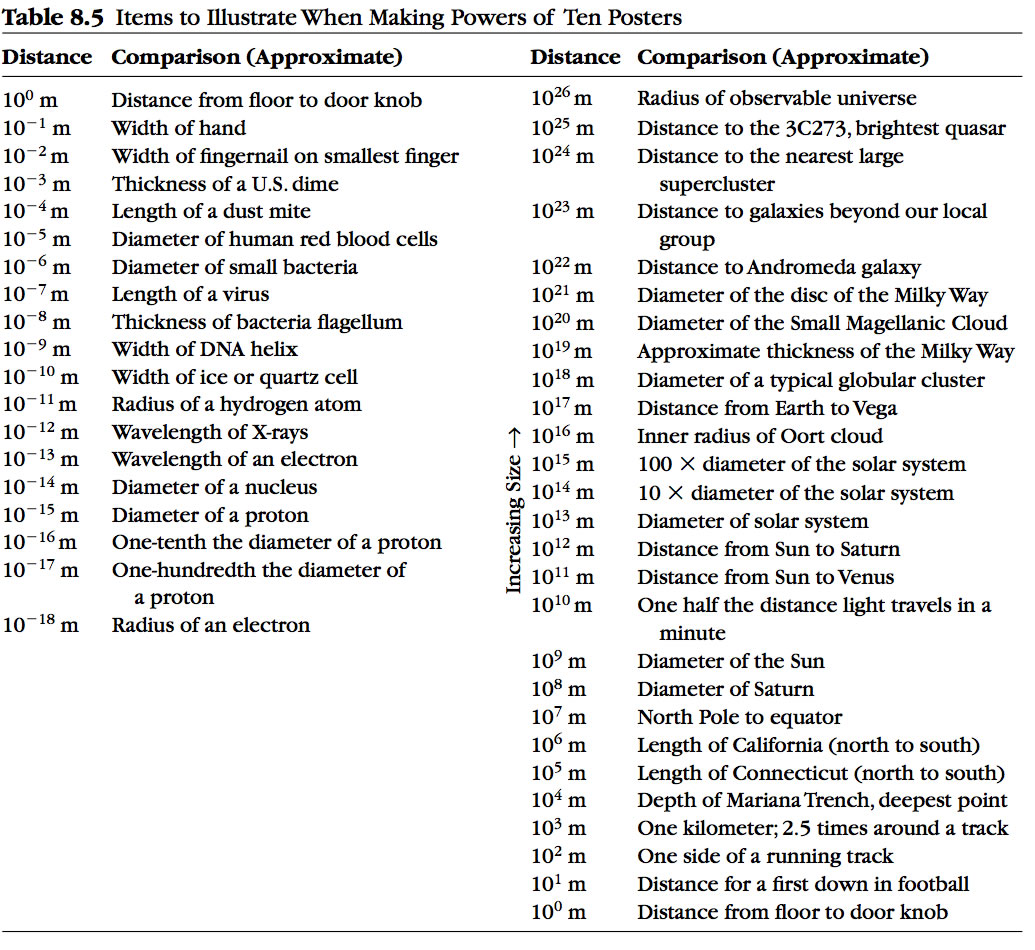
Data viz
Orders of magnitude
Give or take a million, a billion, a trillion.
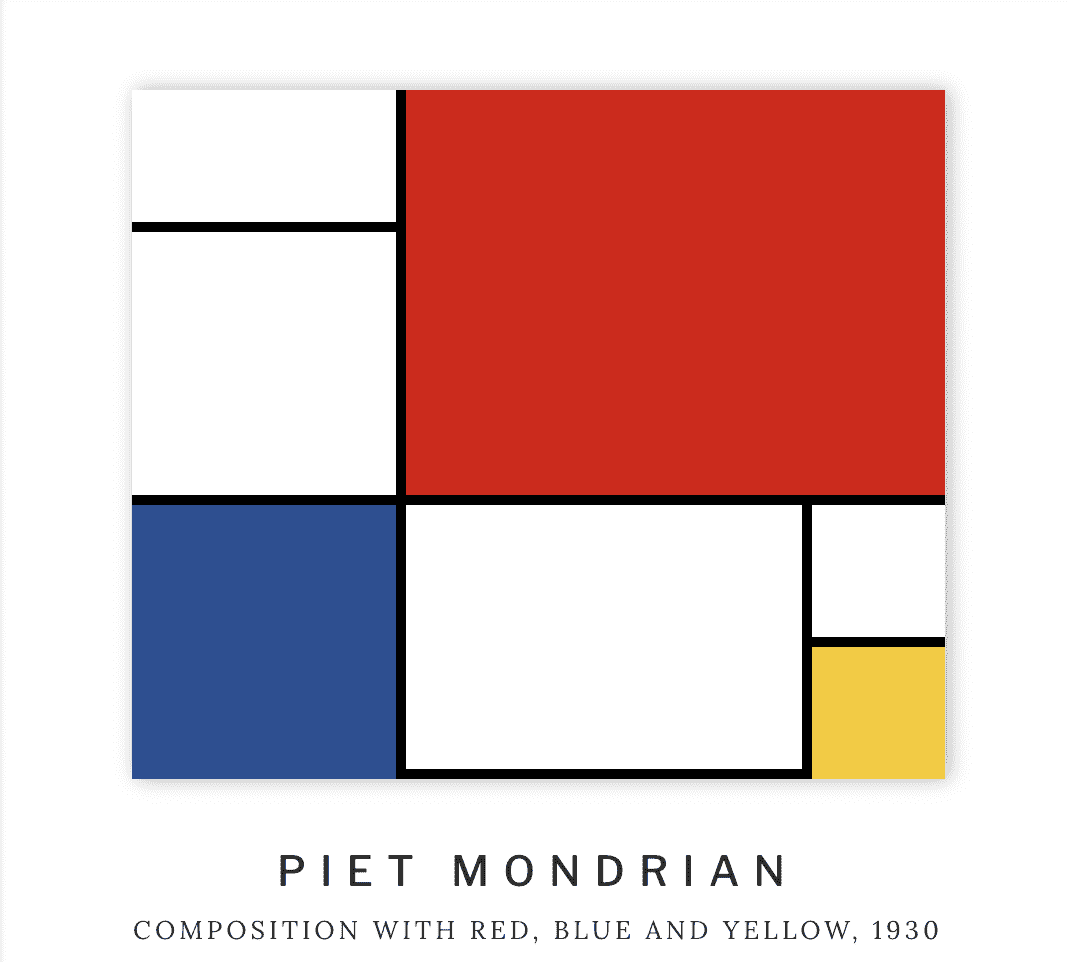
Art
Piet Mondrian in CSS Grid
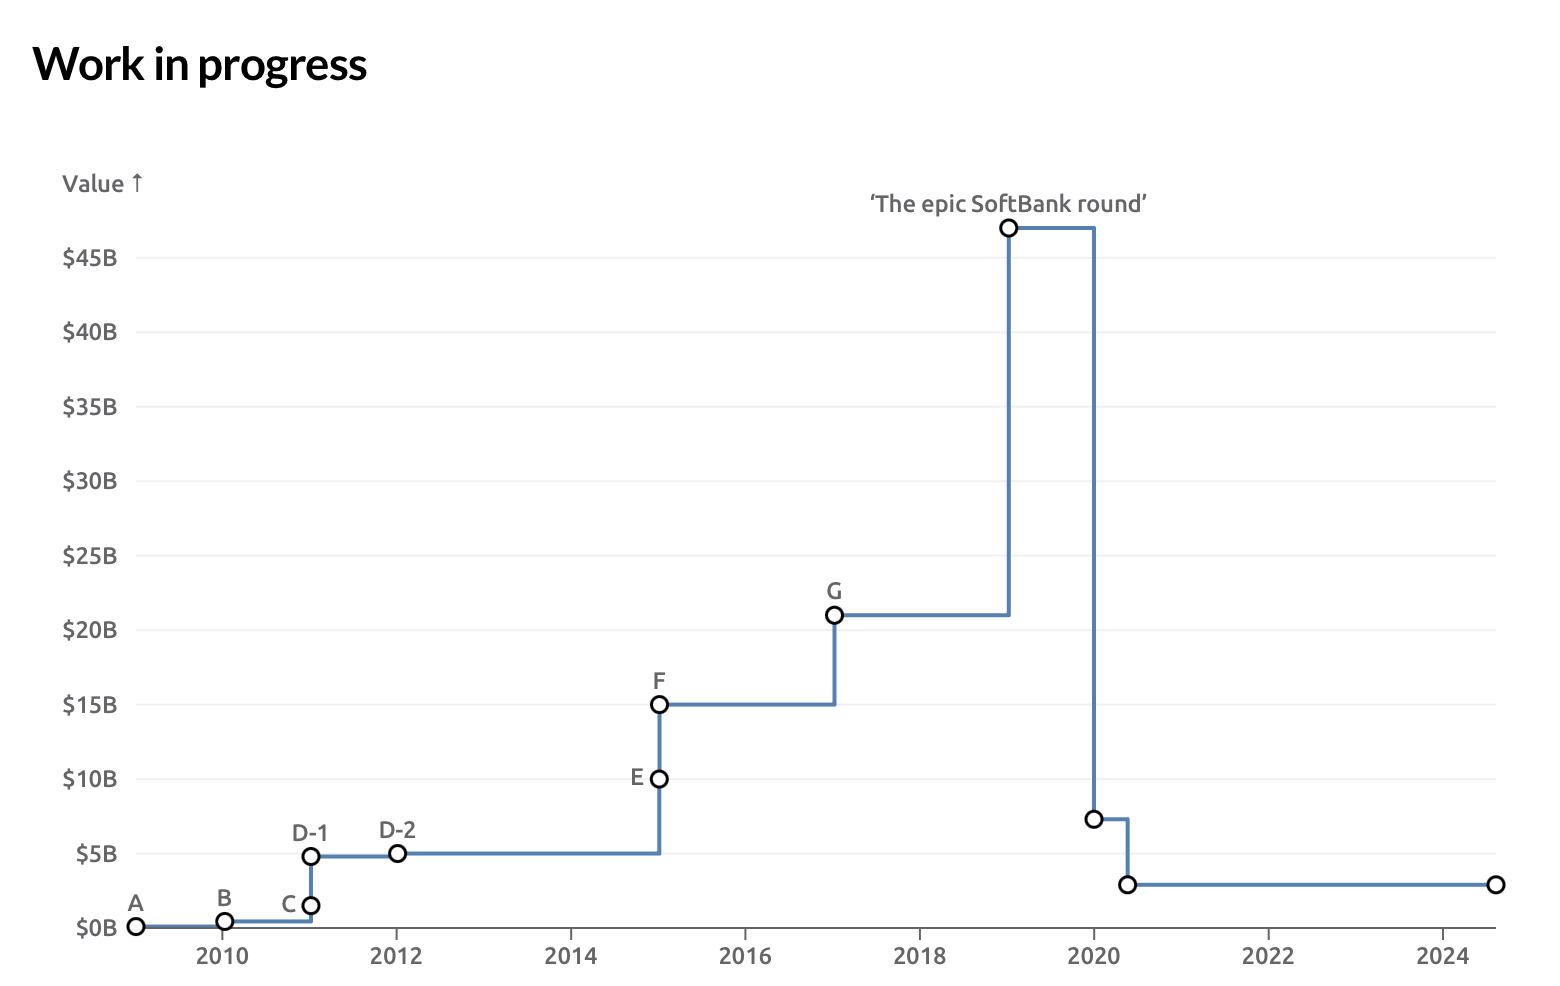
Work in Progress
WeWork Valuation
A balancing act

World
Rio: A city transformed
An olympic revitalization effort

Inf-hoe-graphic
Where rapper Ludacris claims hoes
Based on "Area Codes" (2001)

Design
"Off-White"
OFF-WHITE c/o VIRGIL ABLOH™
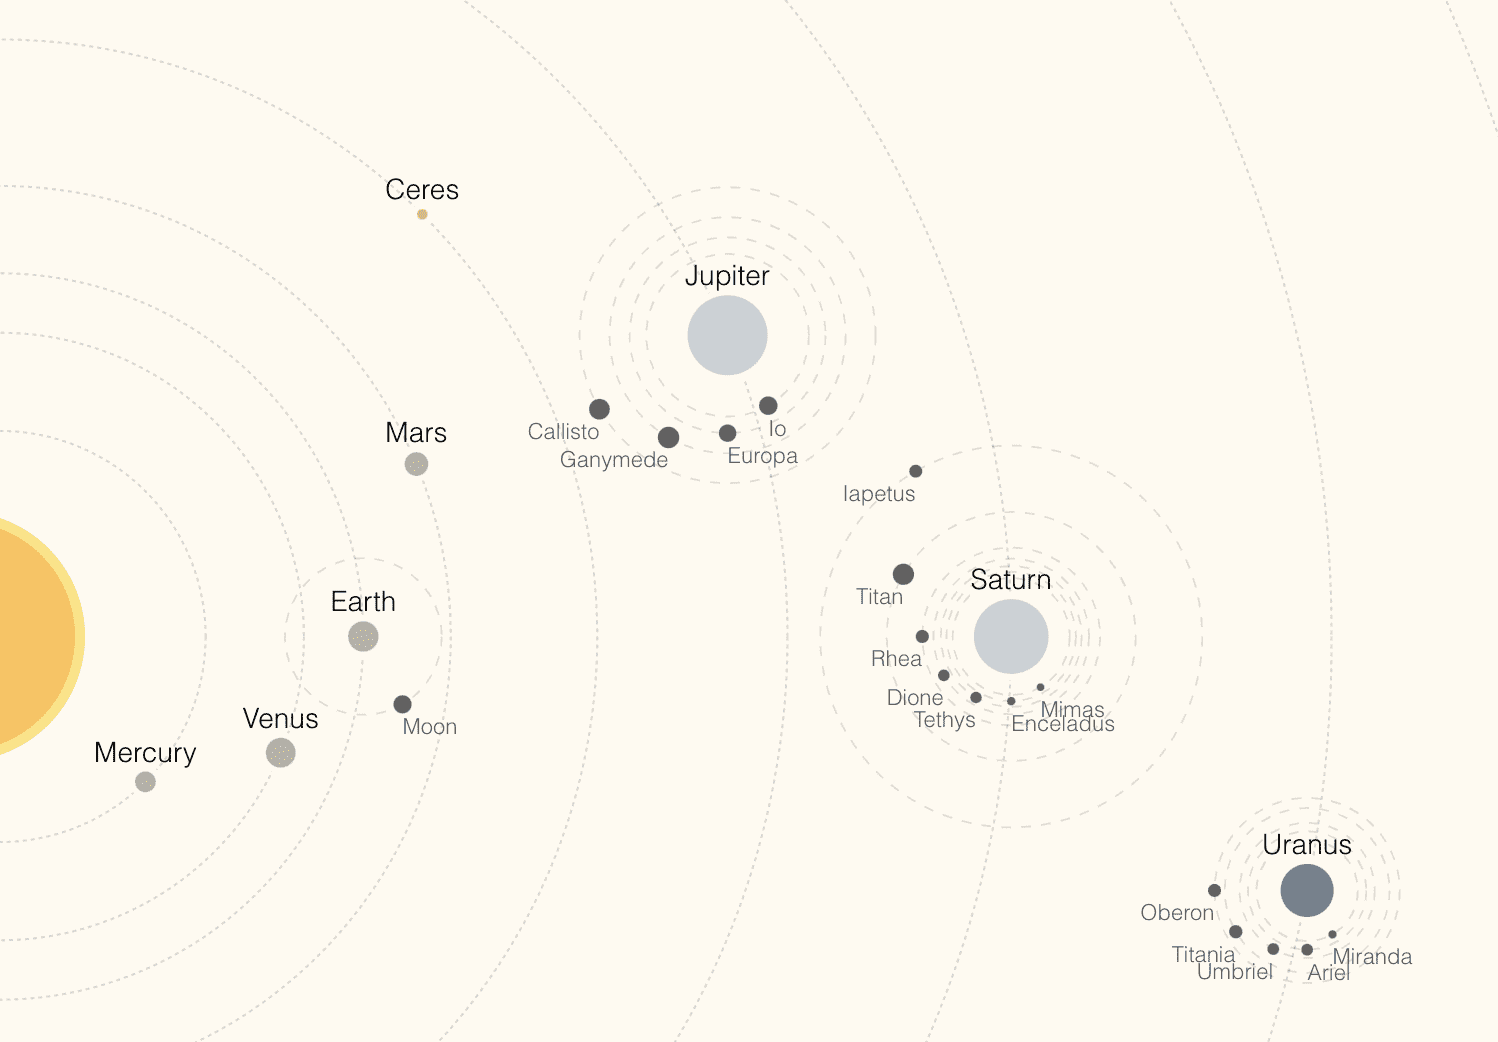
Space
The Solar System
Our pale blue dot
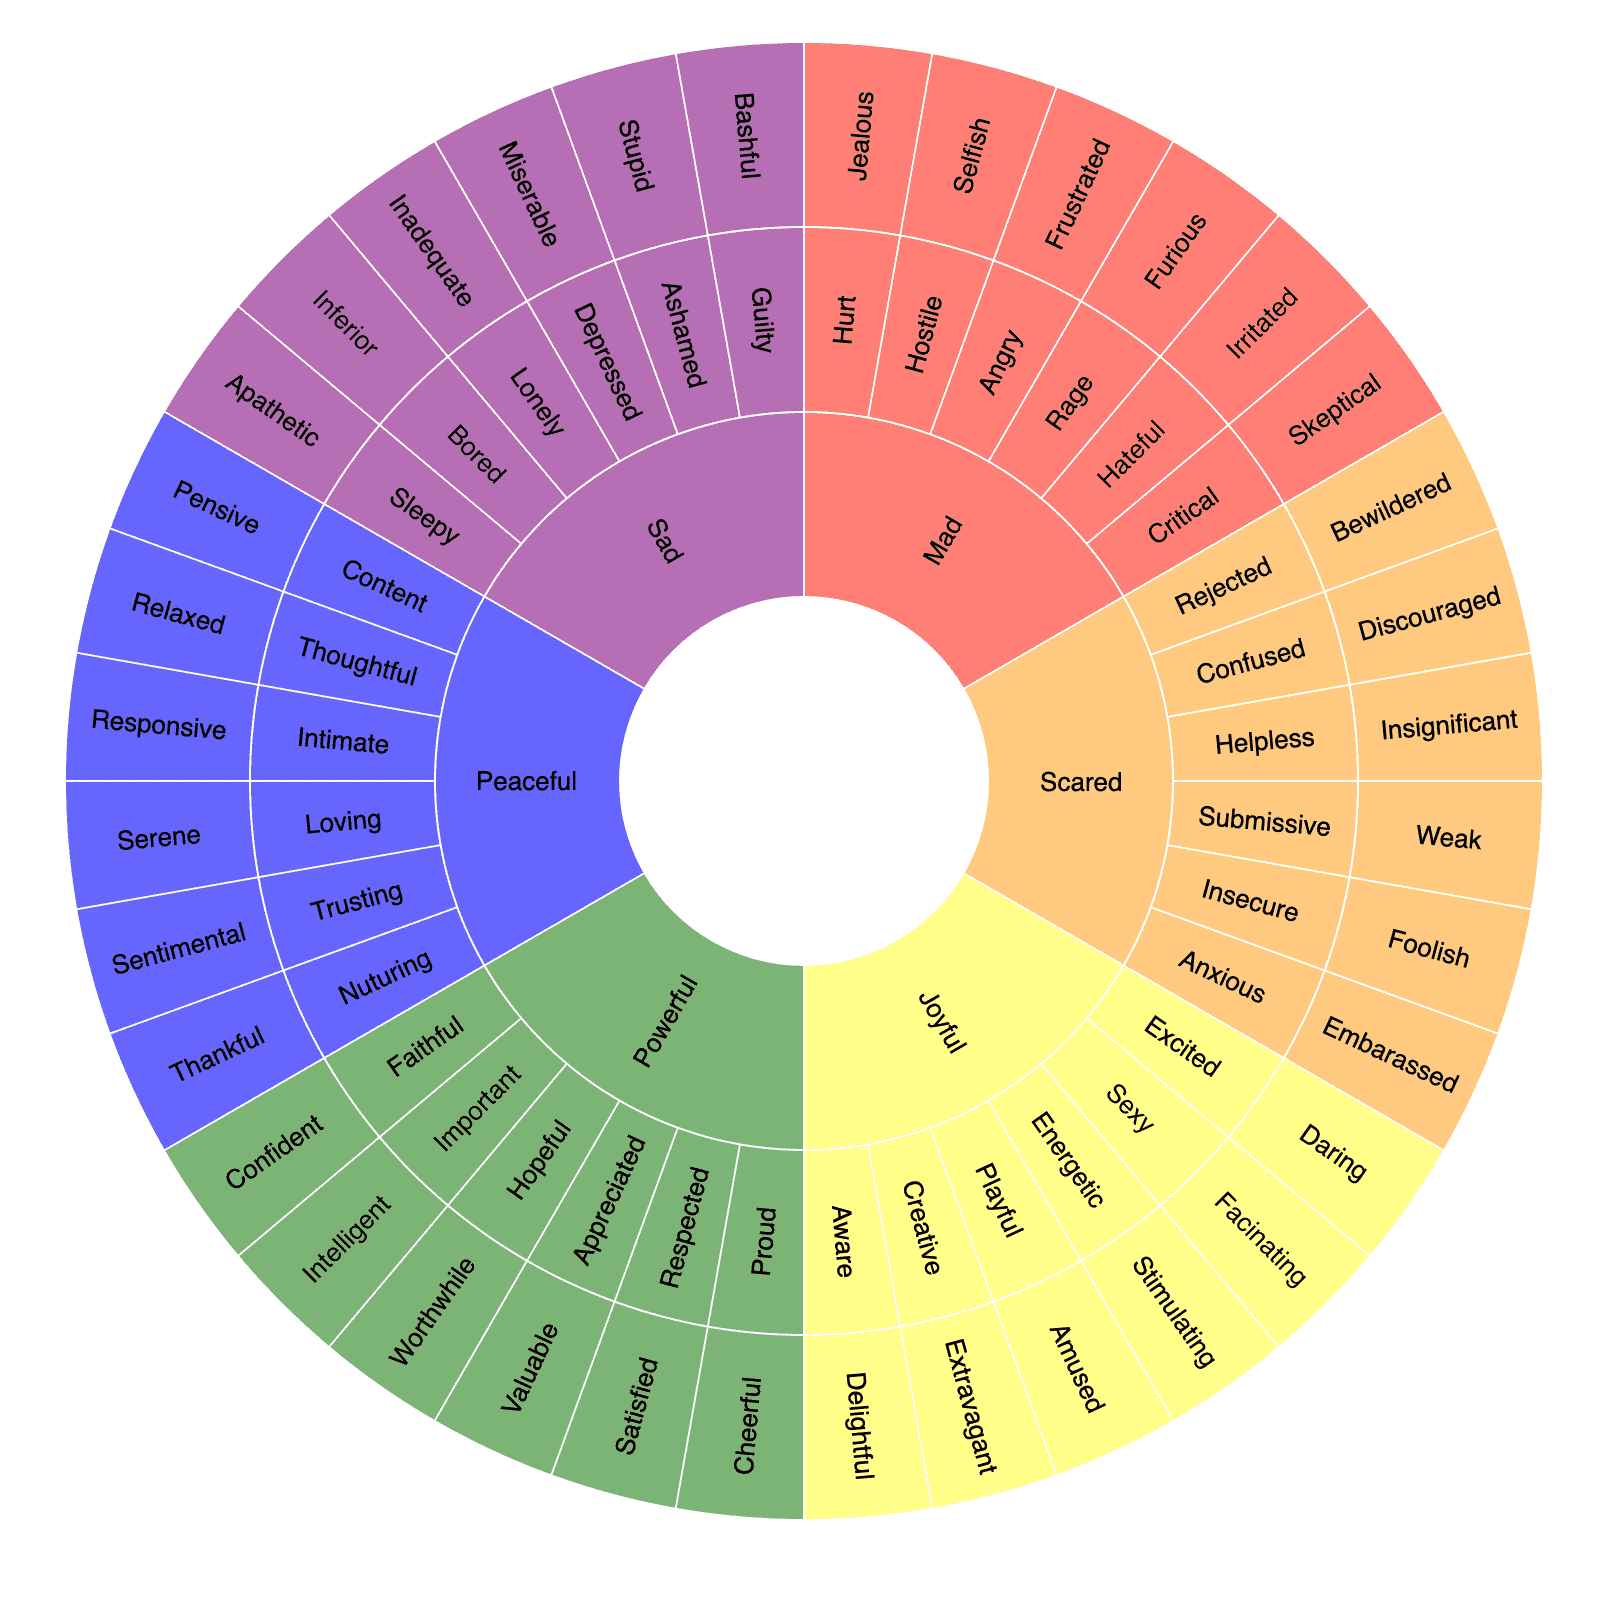
Design
The Feeling Wheel
Created by Gloria Willcox

Work
Customer Satisfaction (CSAT)
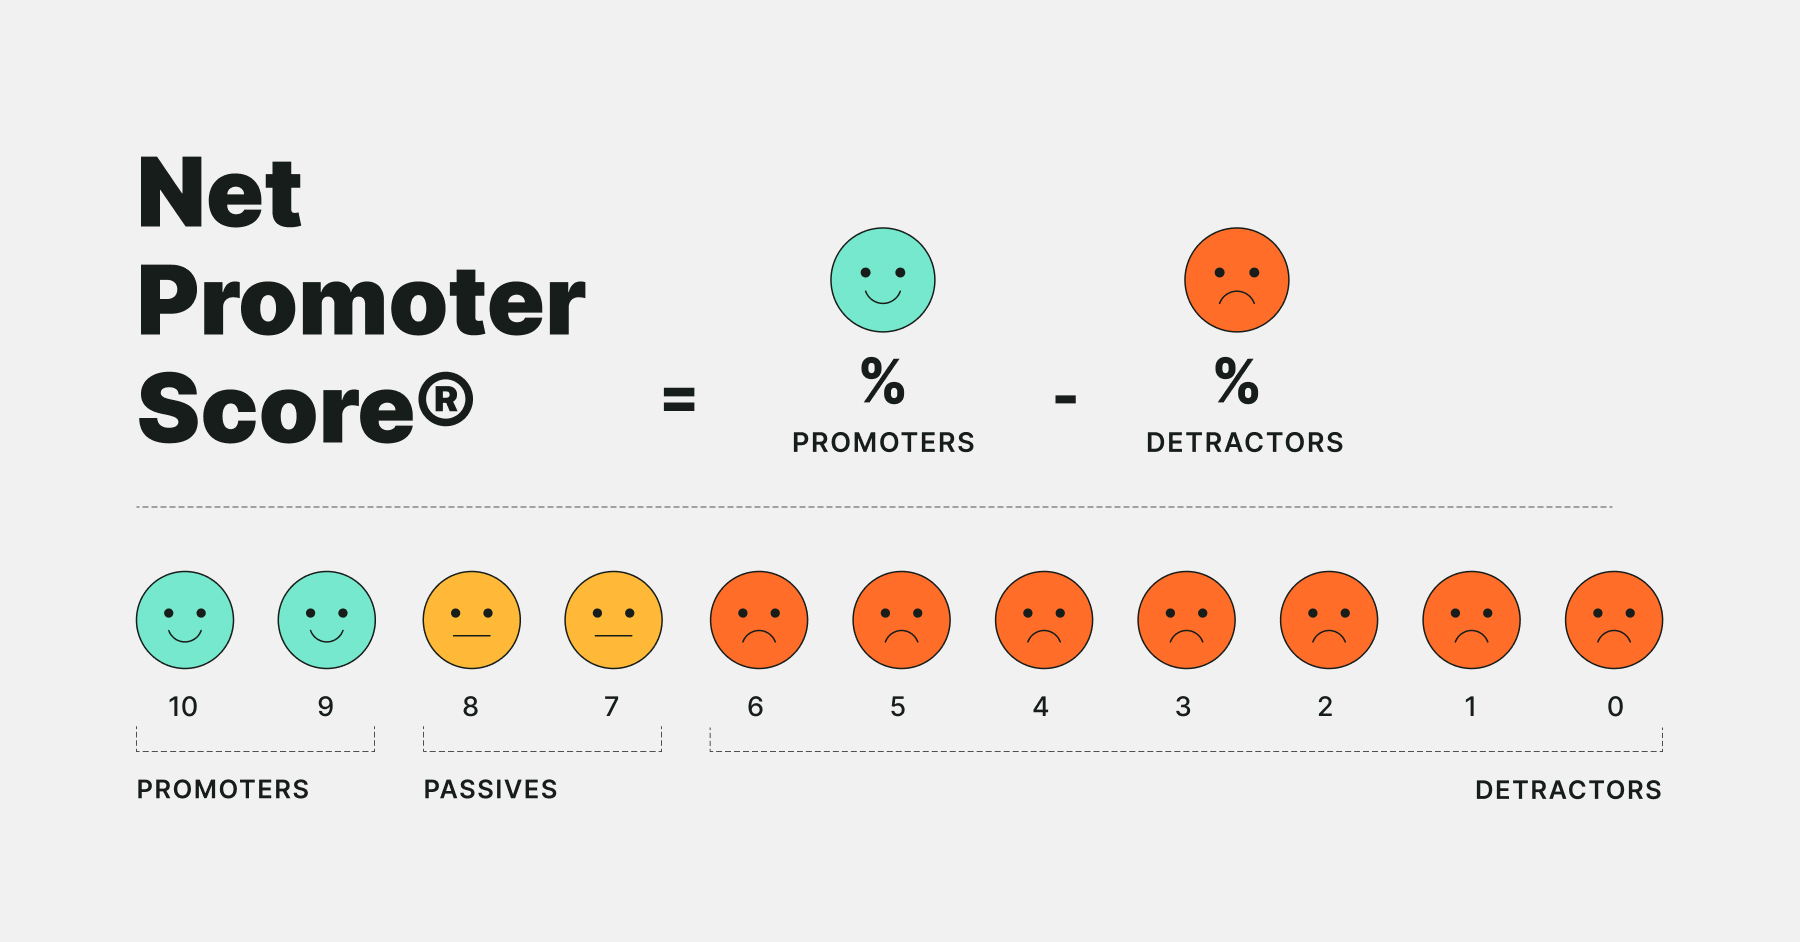
Work
Net Promoter Score (NPS)

Taking Off
The Evolution of Flight

Music
Mac Miller Tribute

Technology
Women in STEM

Design
Wondering about social distancing?
From the NYT

Honest Dating Advice
It's not you, it's me
📚 Books and Culture

TV
SNL
Visualizing 50 years of Saturday Night Live
Lit Crit
Drunk
A history of getting hammered

Lit Crit
Apple in China
Can Apple extricate itself from China?

Lit crit
Review: “Burn Book”

Gaming
GTA V Turns 10
A satirical exploration of American culture

Lit Crit
Demon Copperhead
A journey through Appalachia

Lit Crit
Paved Paradise
How parking explains the world

Lit Crit
Nexus
My review of Yuval Noah Harari's epic Nexus

Trump that
The Failing New York Times

TV
The Sopranos
The Sopranos by the data
Doh!
The Simpsons
My favorite dysfunctional family
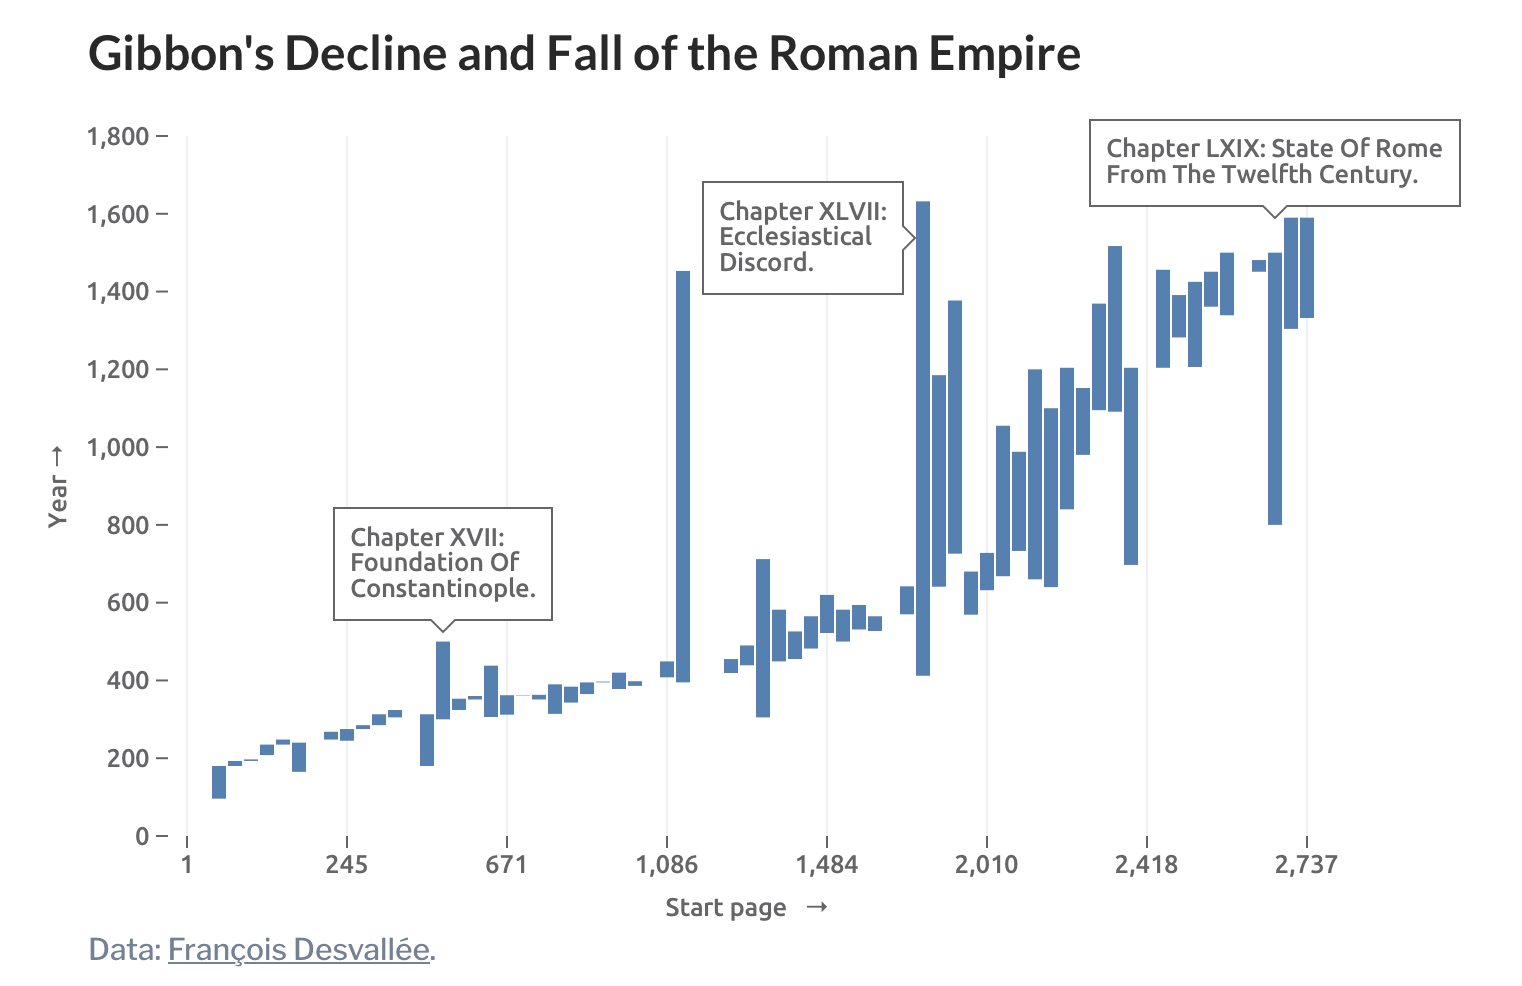
SPQR
The Decline and Fall of the Roman Empire
From historian Edward Gibbon
Music
Red Hot Chili Peppers Tribute
Suck my kiss
Code

CSS
Venn Diagrams
CSS Venn Diagrams

Tech
The demise of Stack Overflow
Death by LLM

A11y
Web Accessibility
Build something that works for everyone.

Code
Frontend Fundamentals
Intro to HTML
Code
Charts & Graphs
Data visualization options compared
Reading
Developer Resources
A list apart
Code
CSS selectors
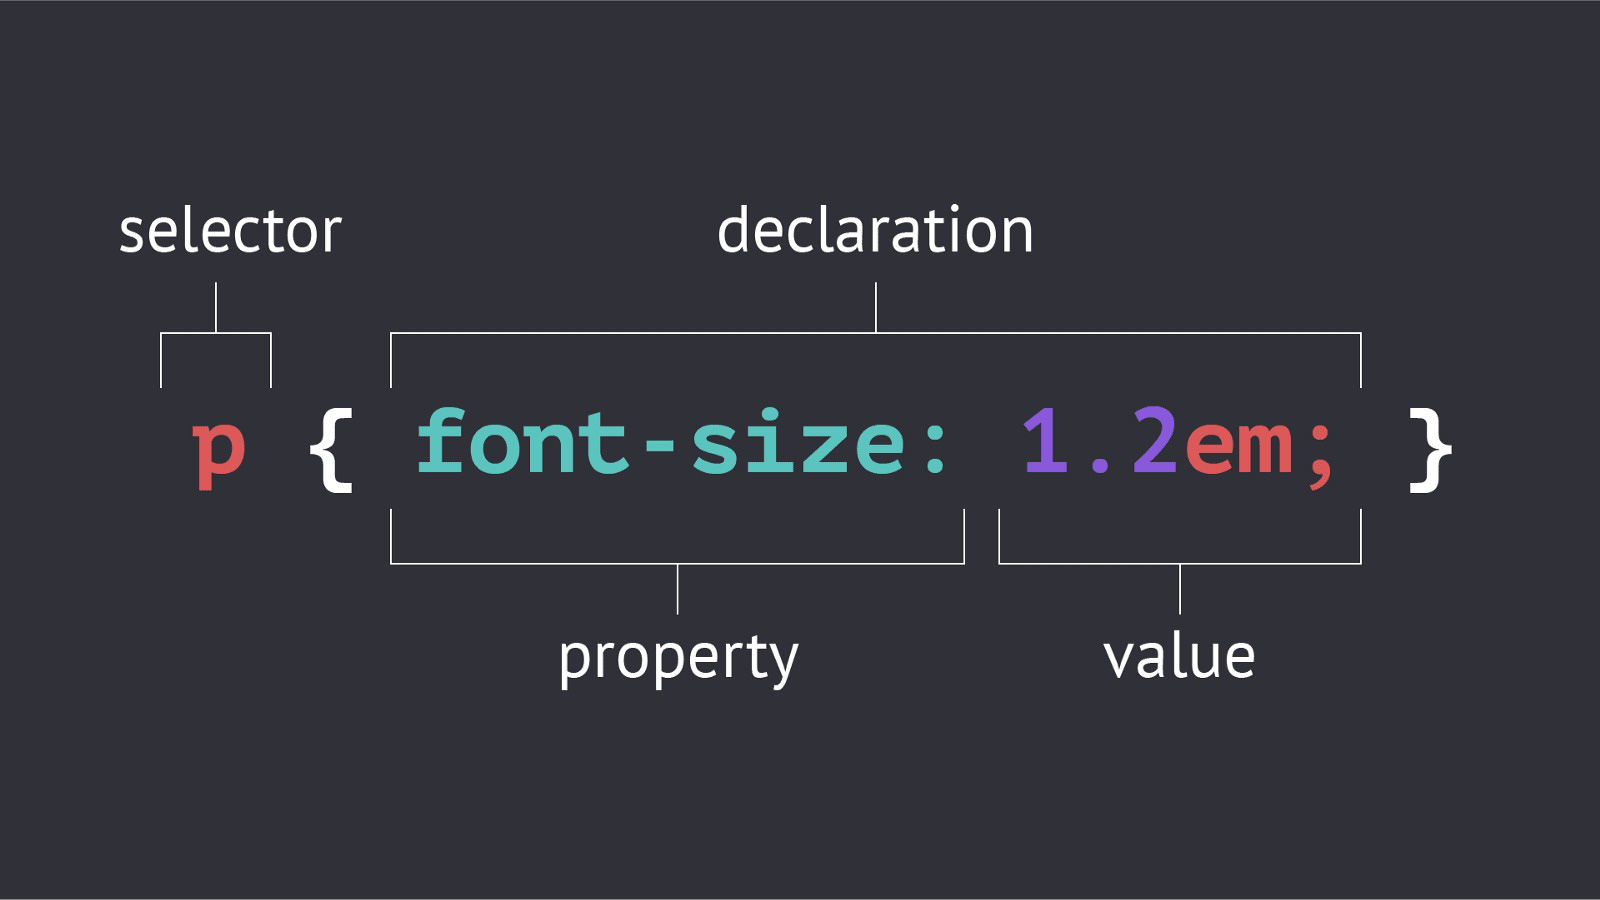
Code
Cascading Style Sheets
Data viz
OpenAI Timeline
From Sam to Sora

Design
Practical UI Details
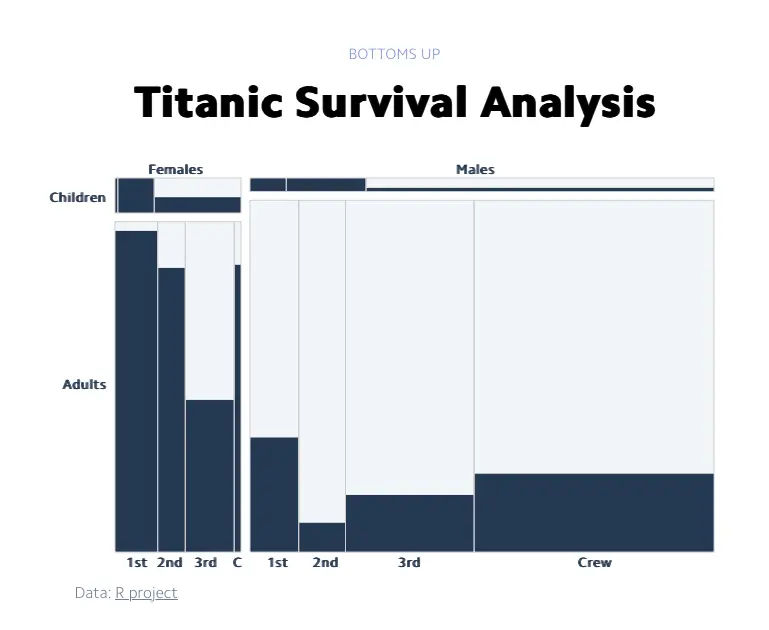
Data viz
Titanic survival analysis
A ship of gold in the deep blue sea
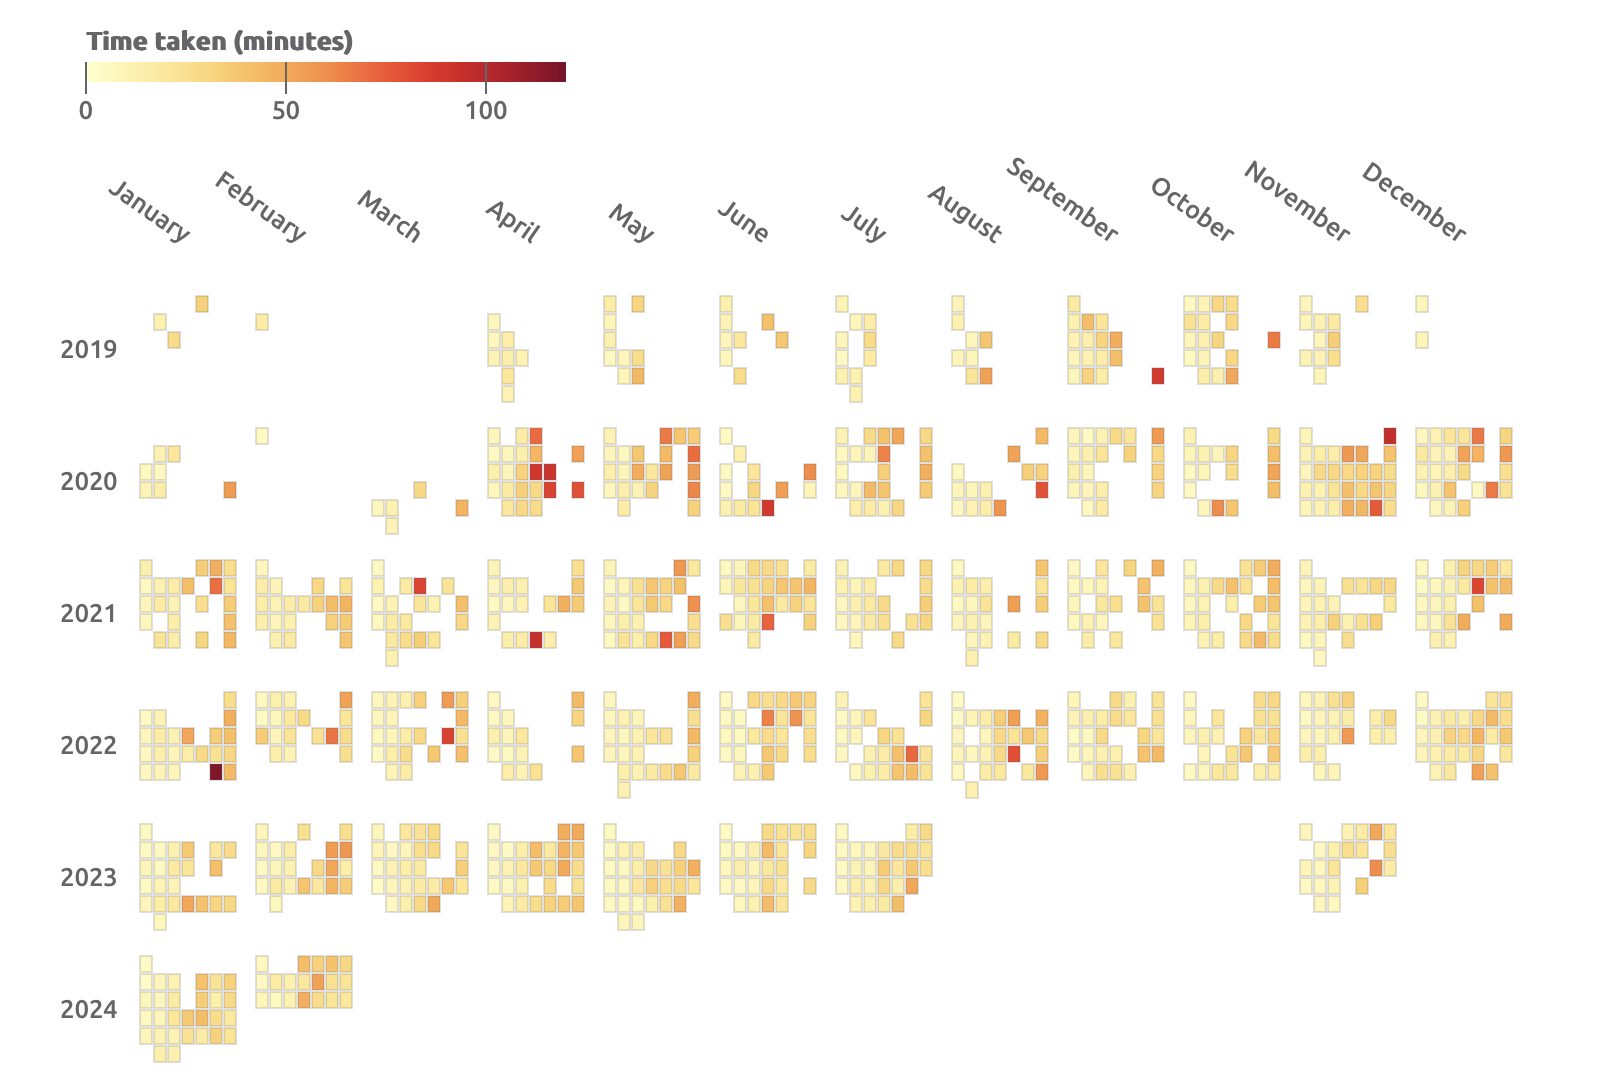
Data viz
Crossword Puzzle Stats
Hold my Oreo
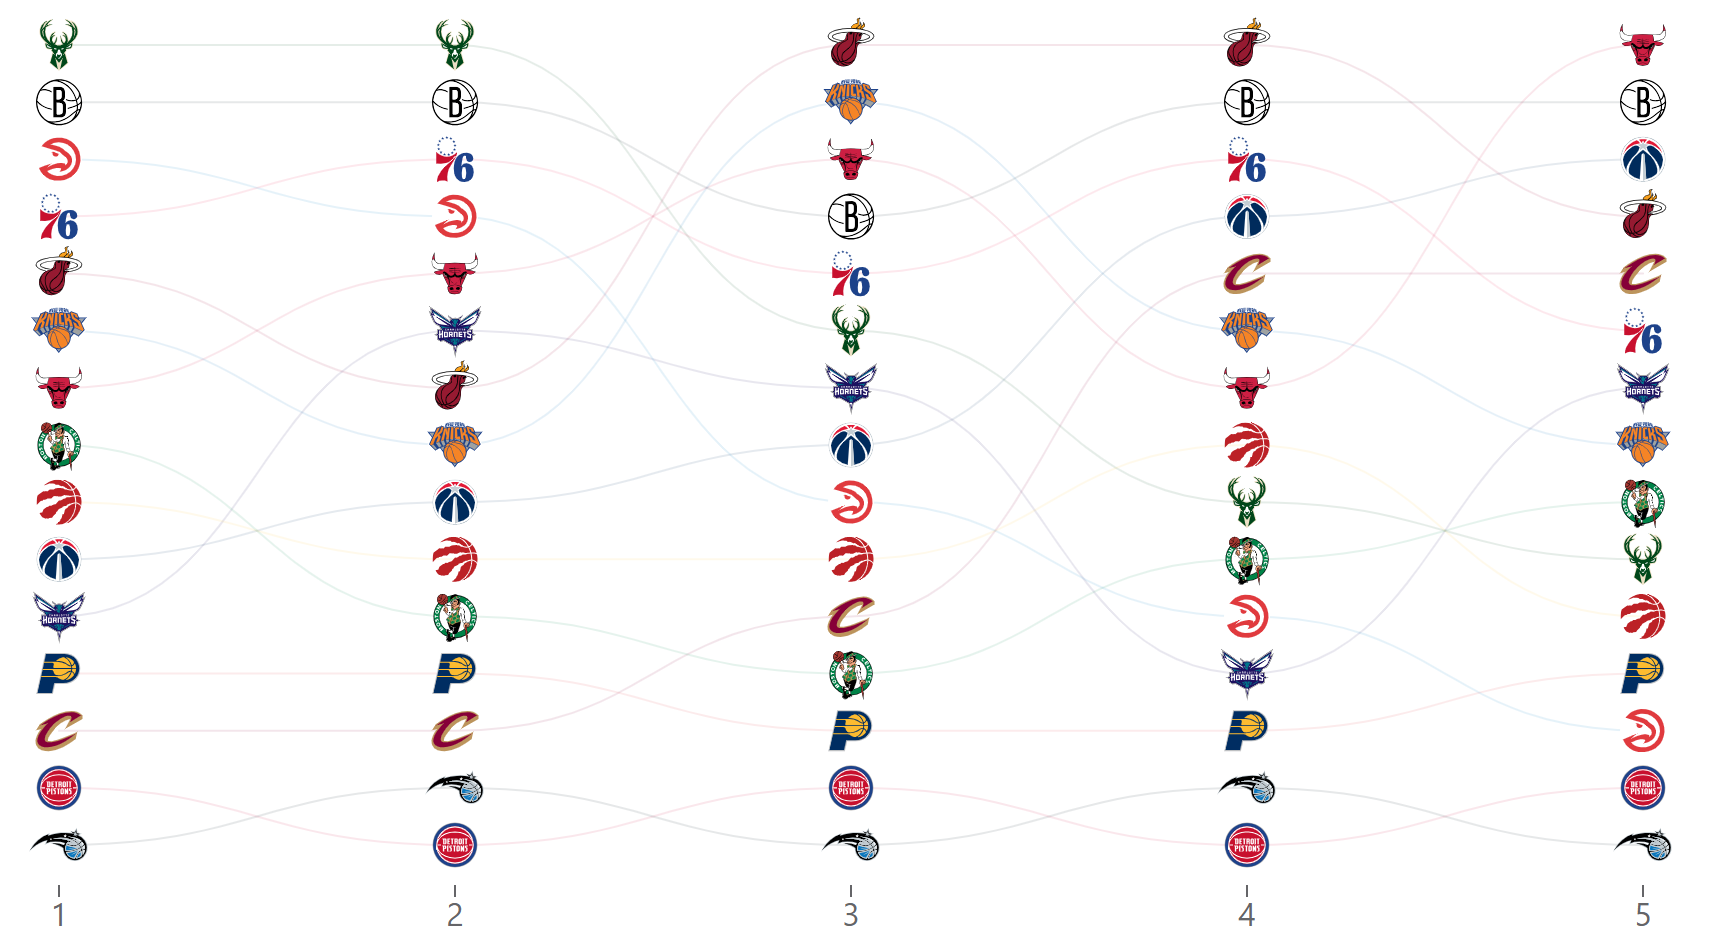
Sports
Basketball stats
Data visualization in the NBA
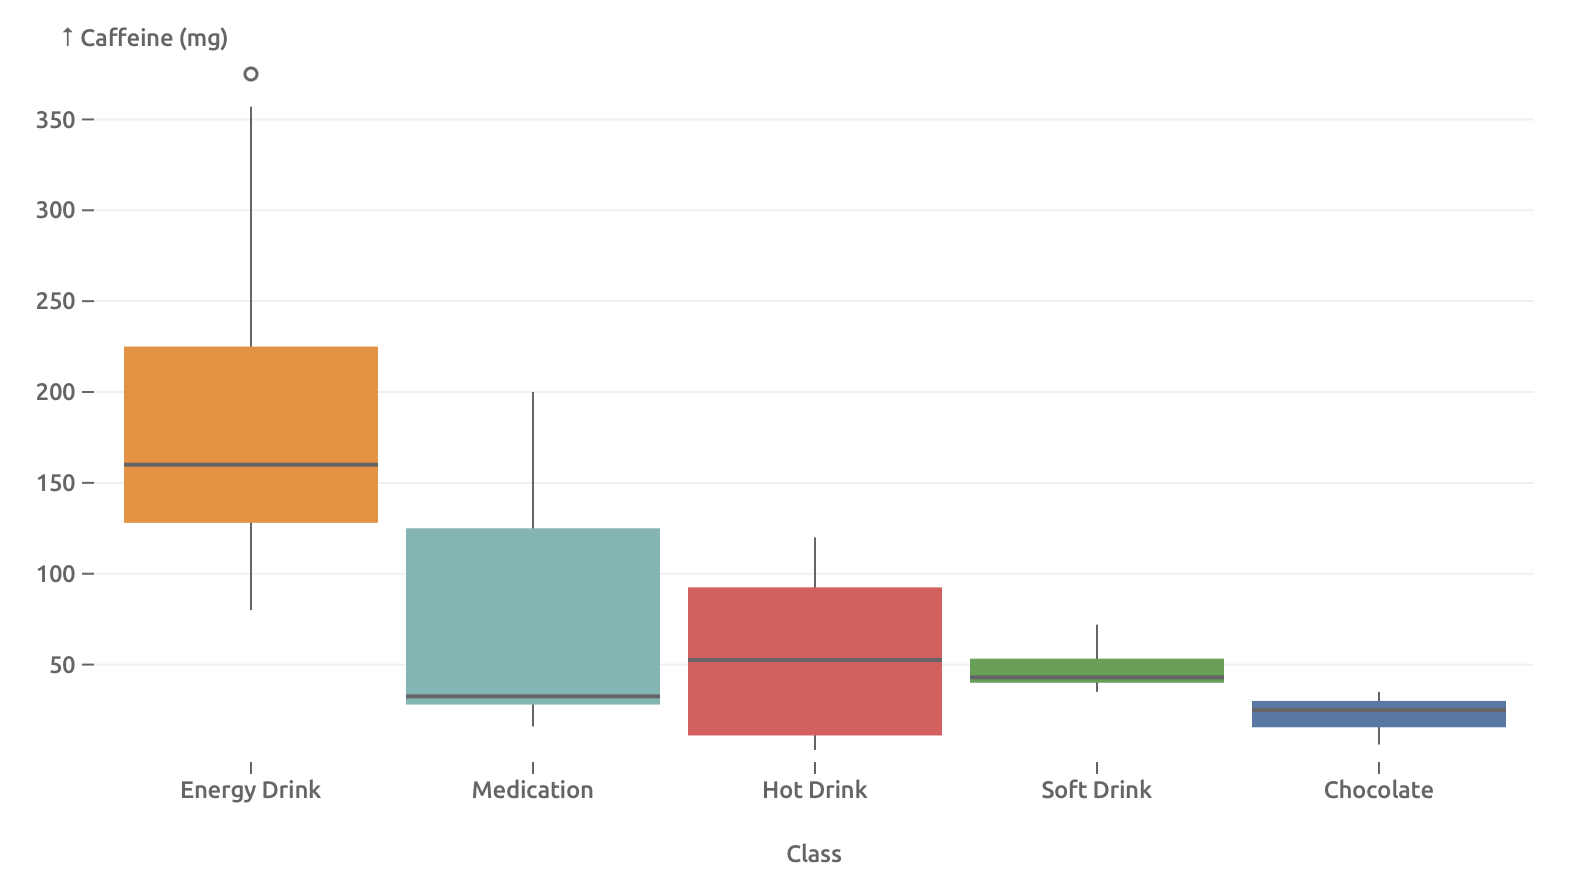
Data viz
Caffeine Data Visualization
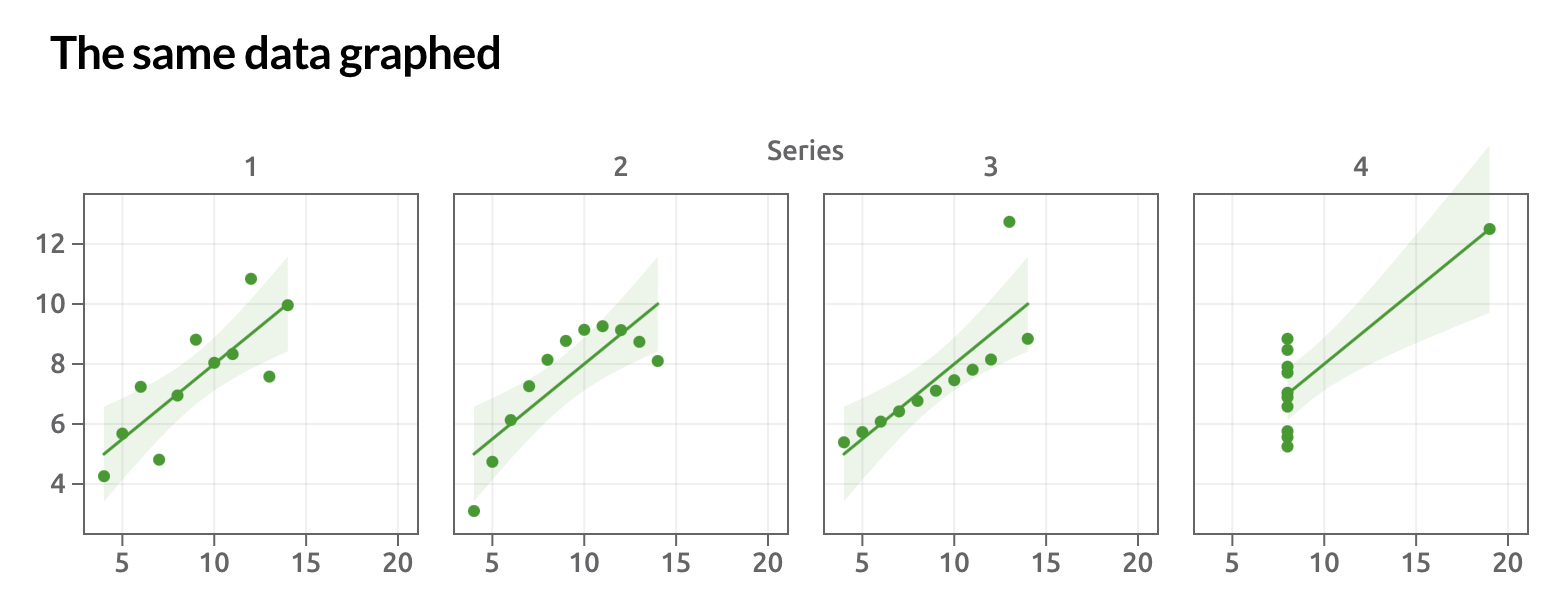
Math
Anscombe's Quartet
The importance of visualizing data

Terms & Conditions
Data visualization glossary
Math
Equations that changed the world
Eureka!

Apple
WWDC16
Apple Worldwide Developer Conference
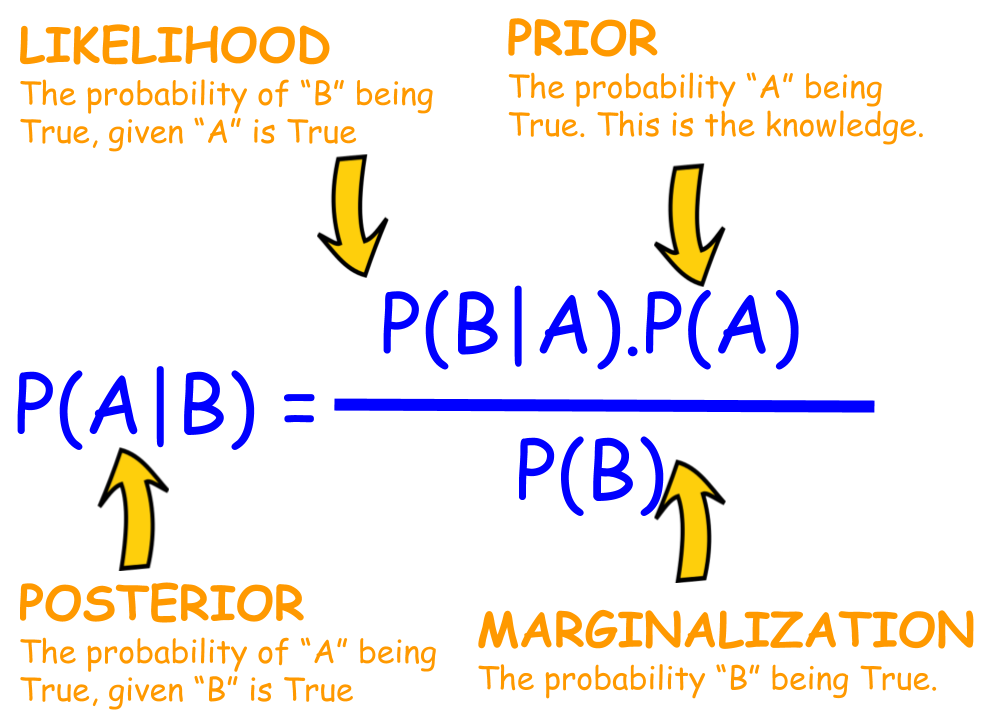
Statistical techniques
Bayes Theory
In praise of Bayes
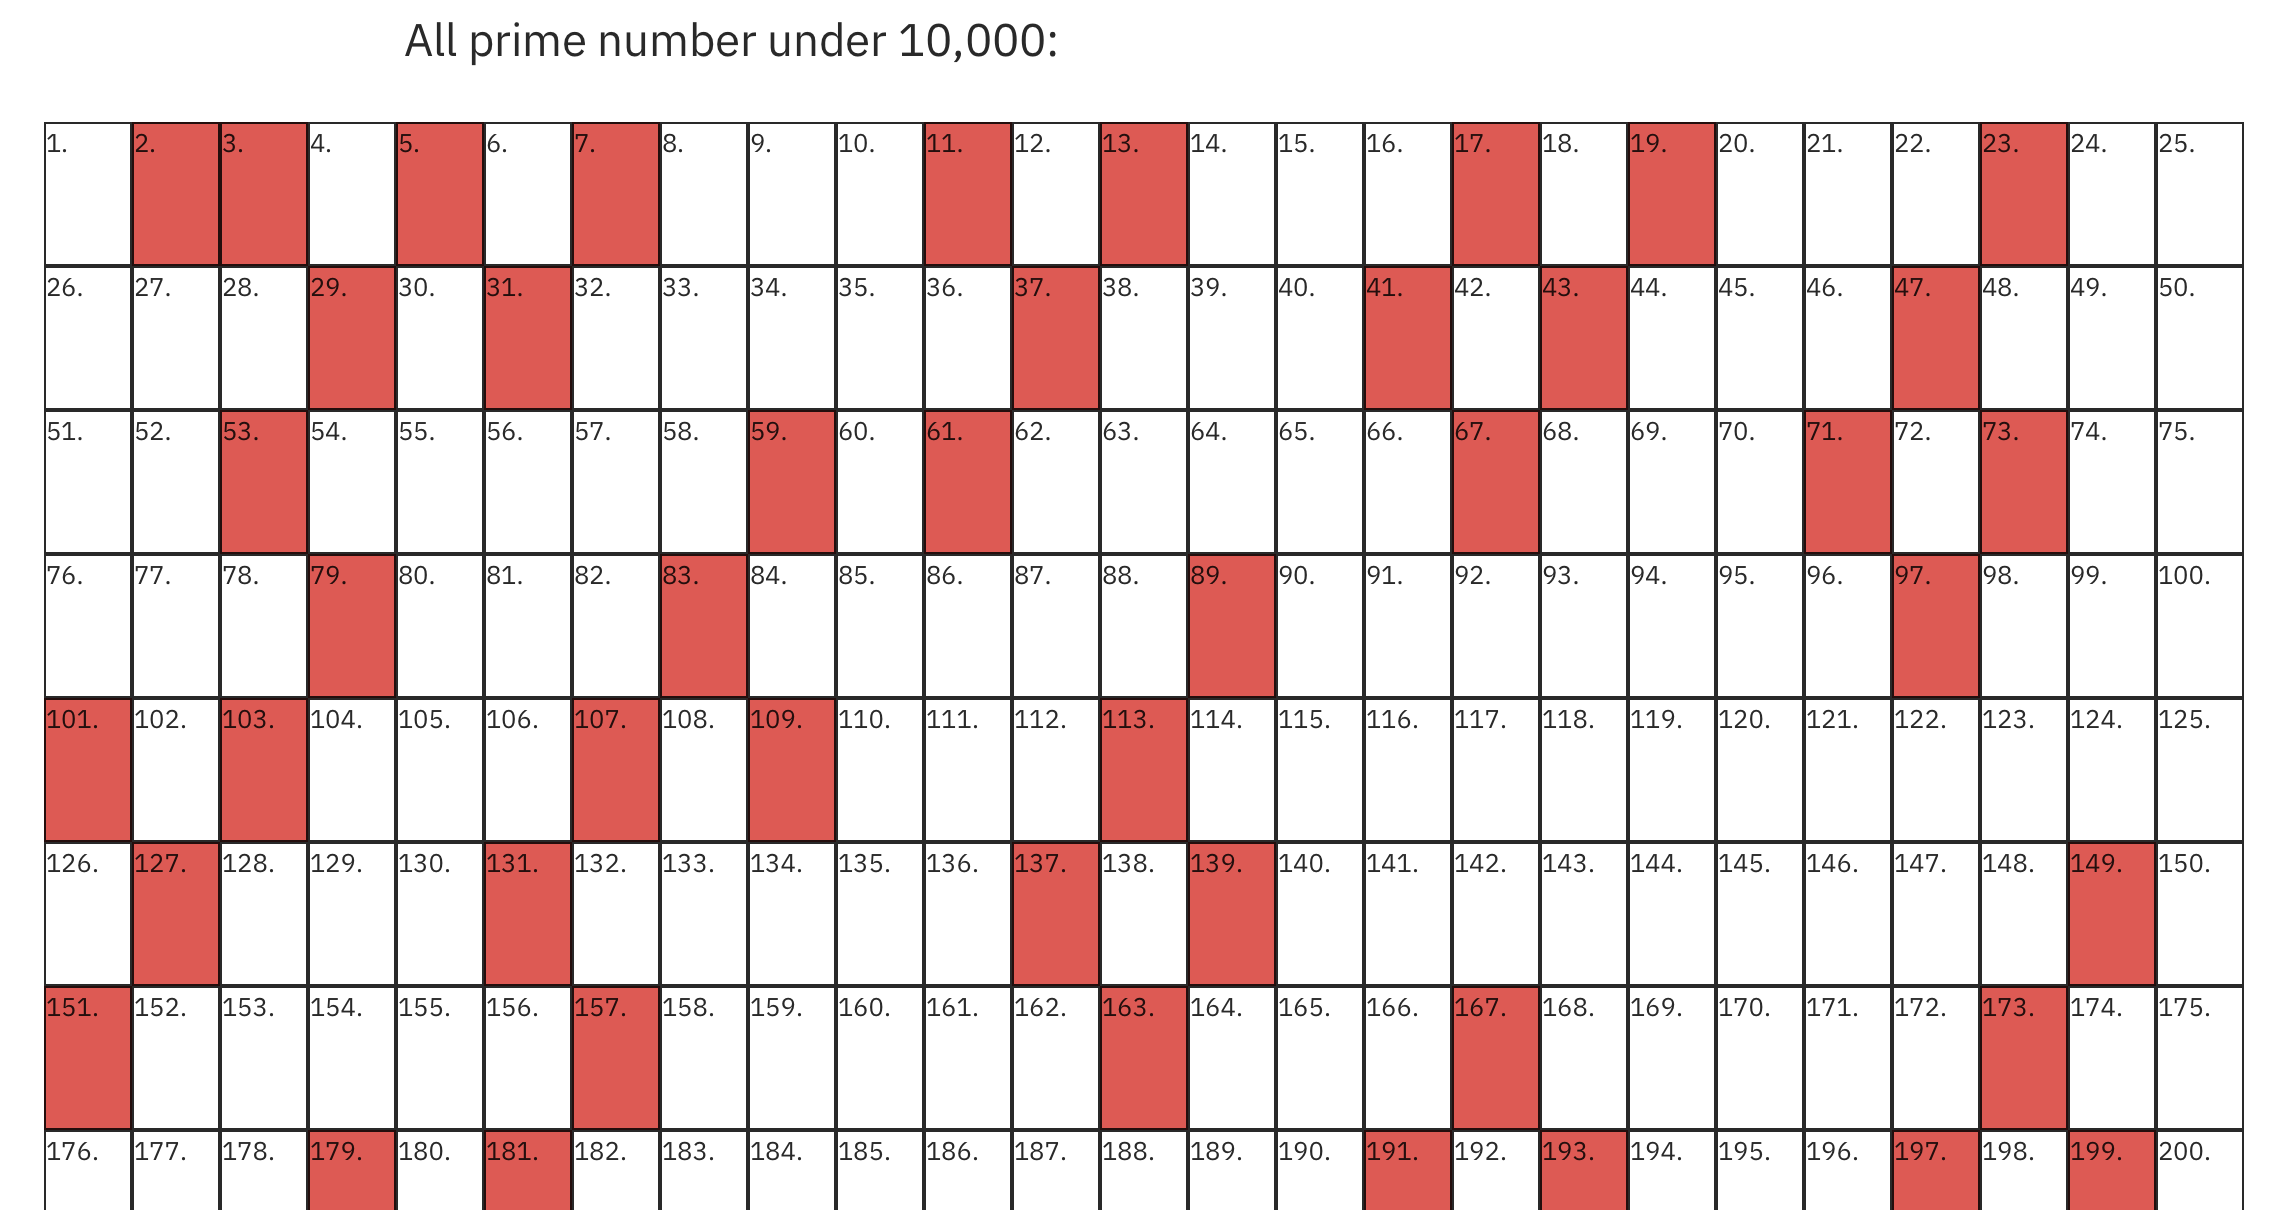
Math
Prime Numbers

Design
Spinning Rings Illusion

Blog
Hello World

Technology
Windows XP

Data viz
Hogwarts School Cup
Why does Gryffindor always win?
Just for fun

Dad API
Just jokes
Rock
Thrillhouse

Design
RBG in RGB
The ‘Notorious RBG’
Social Networking
Honest LinkedIn
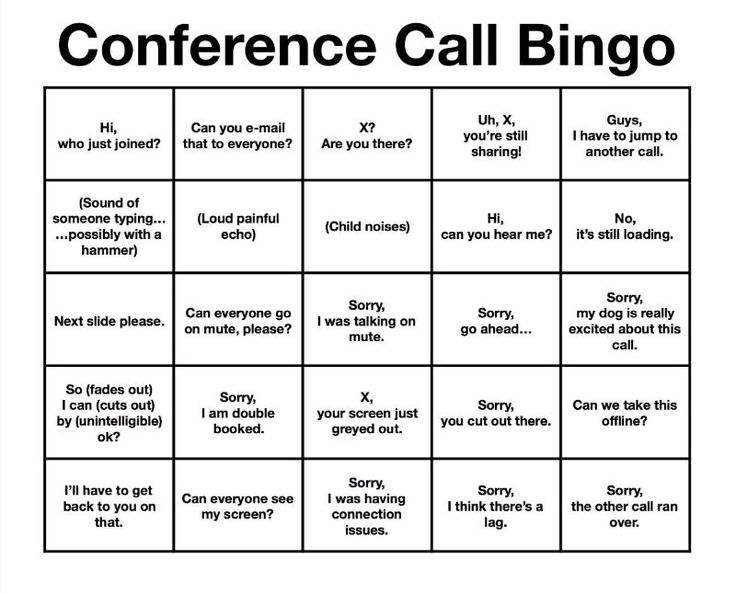
Zoomies
Conference Call Bingo
Sorry, I was on mute

Meme
Arthur's Fist
I'm shaking

Ad rep
Get Fit

Math
Powerball & Random numbers
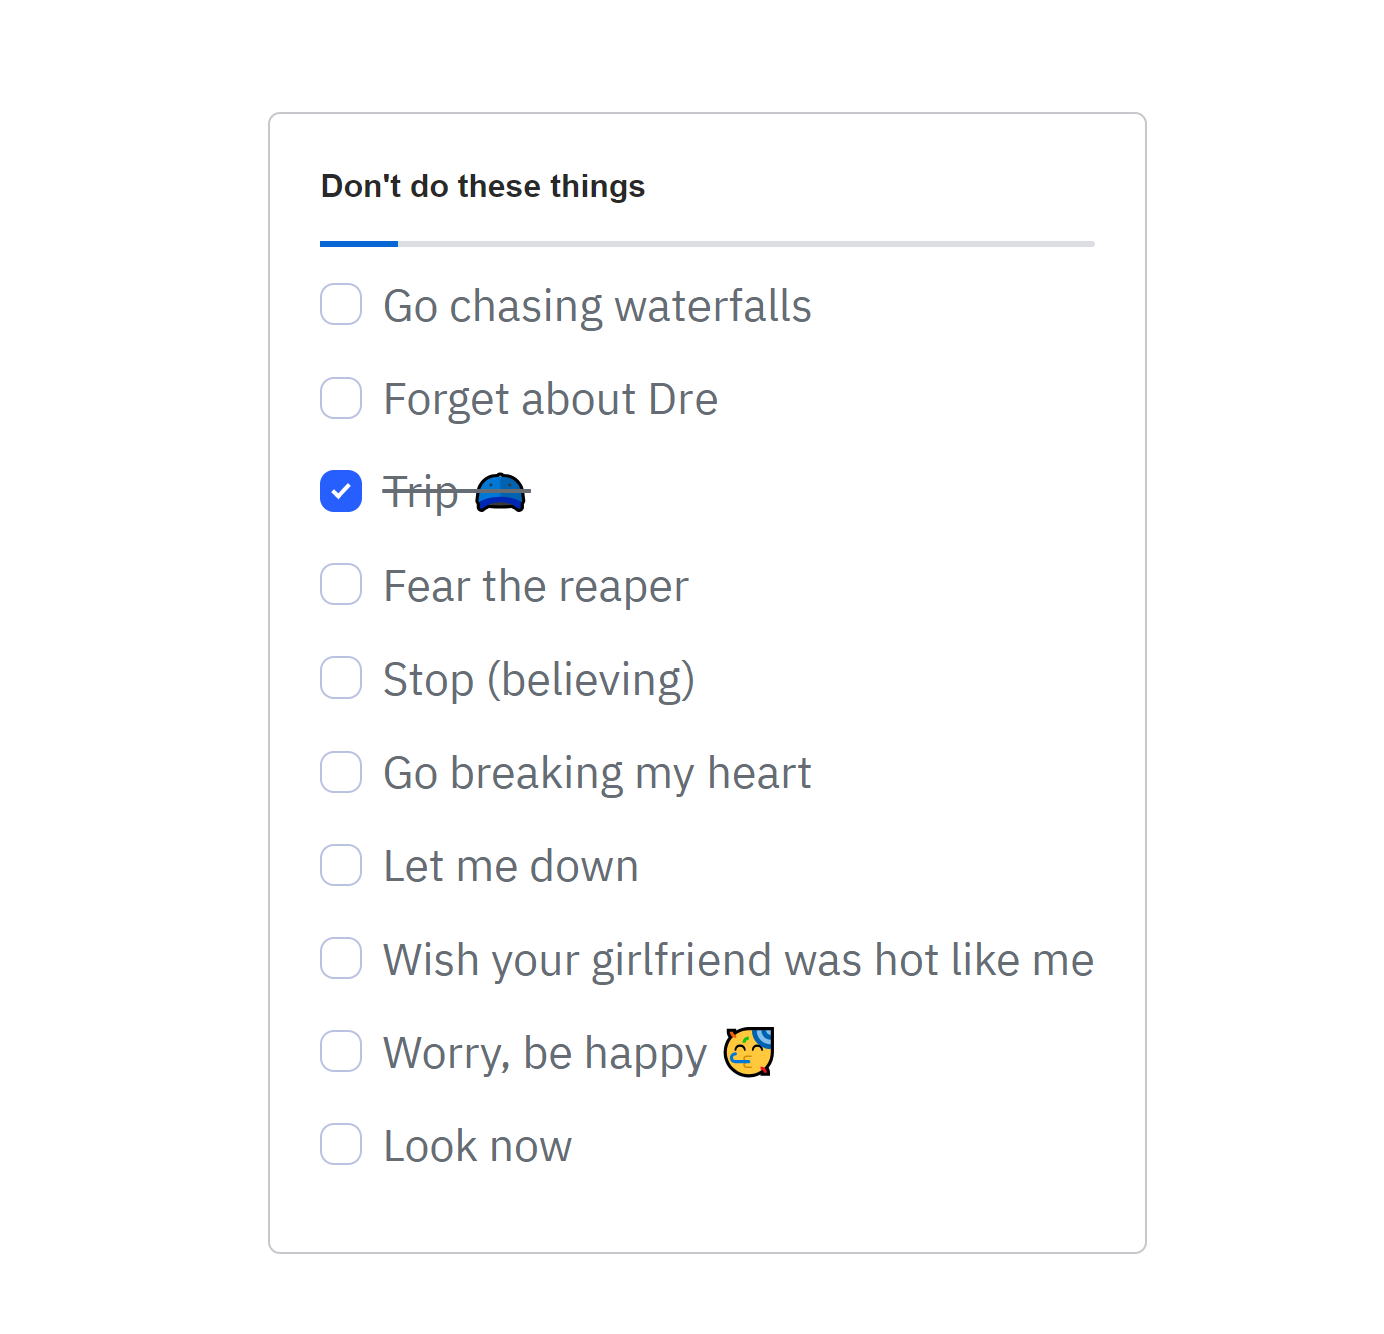
Fun
To-Don't List
Don't do these things
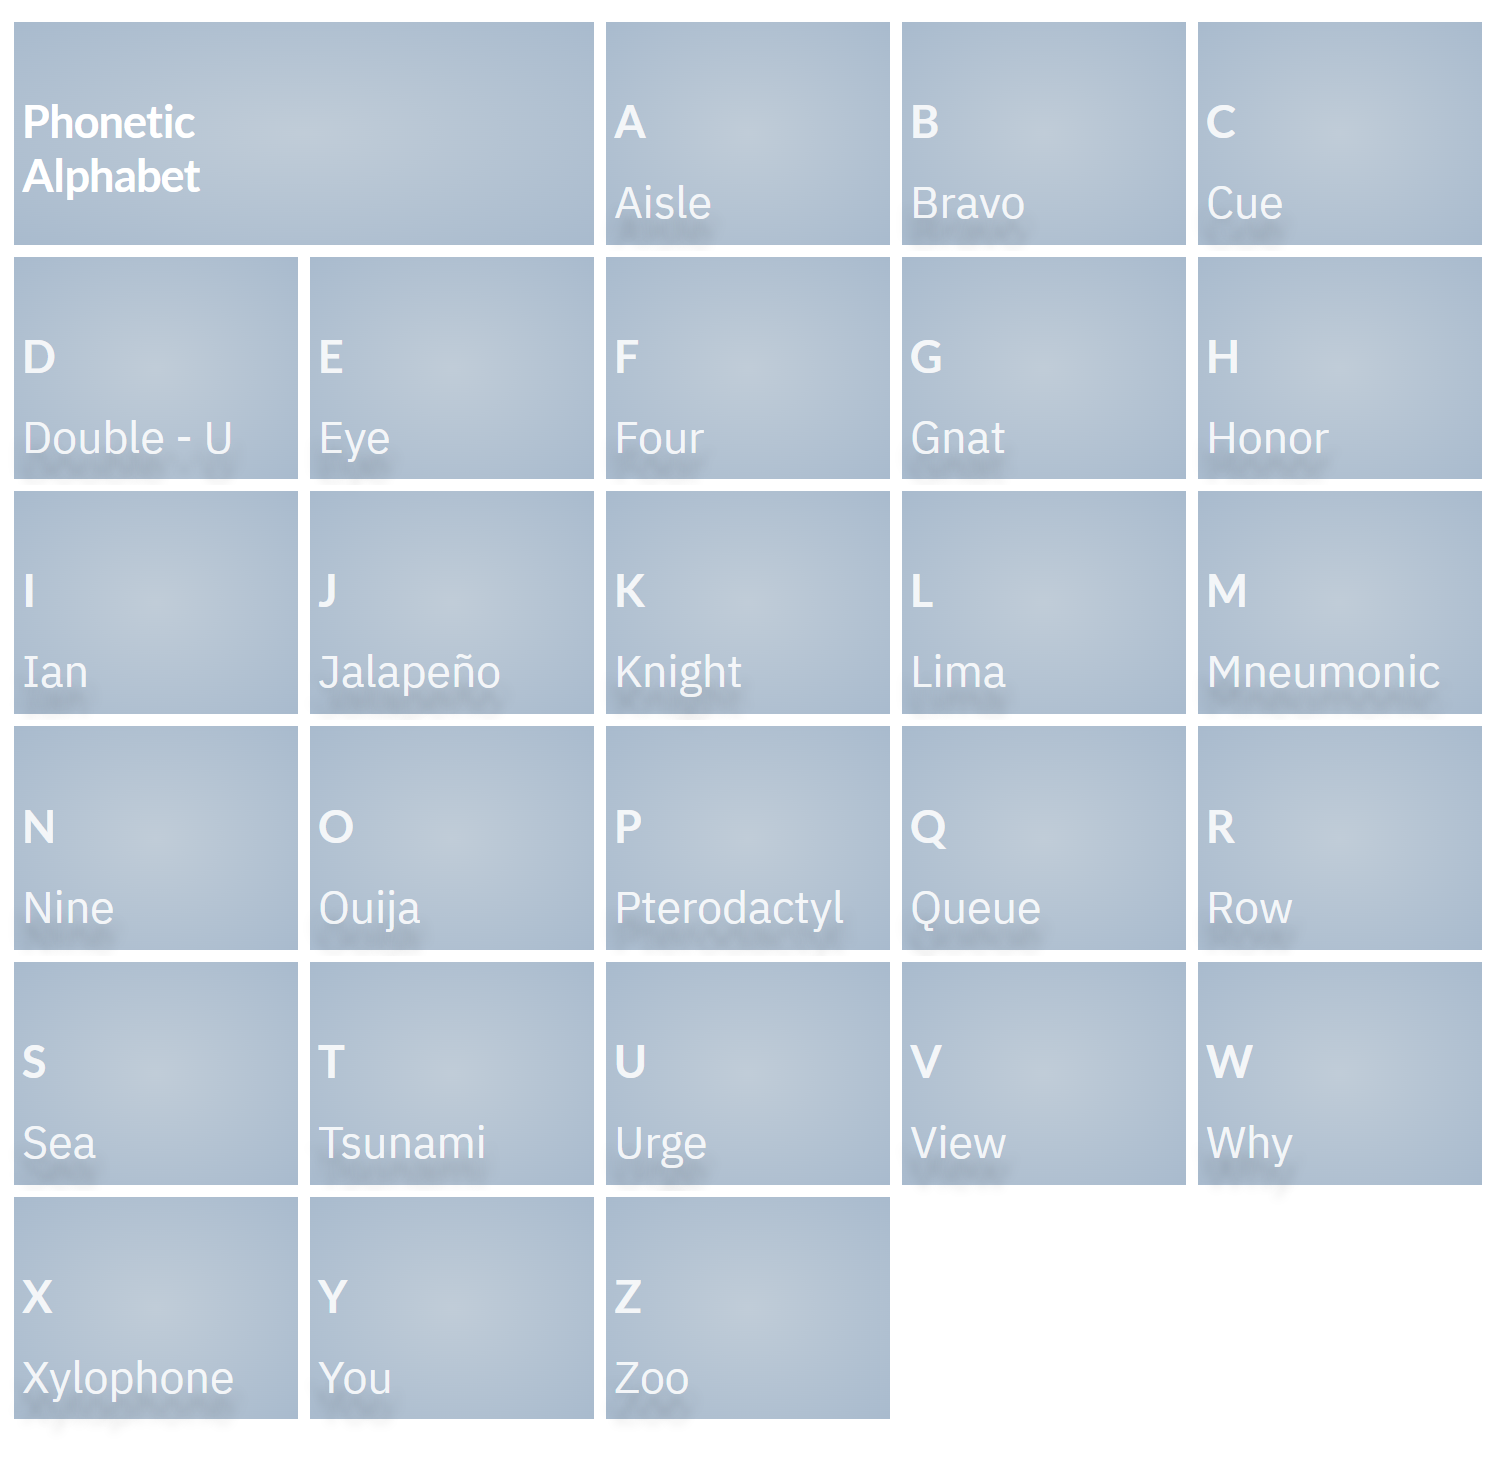
ABCs
Phonetic alphabet

Skeumorphism
Radio Buttons

Punny
Word Avalanches

Fun
Tic-Tac-Toe
Play Tic-Tac-Toe

Comic Sans
XKCD Security Tips
Use a burner laptop

Music
We Didn't Start the Fire
A pictorial chronology
Design